Download
1 / 60
600 likes | 704 Views
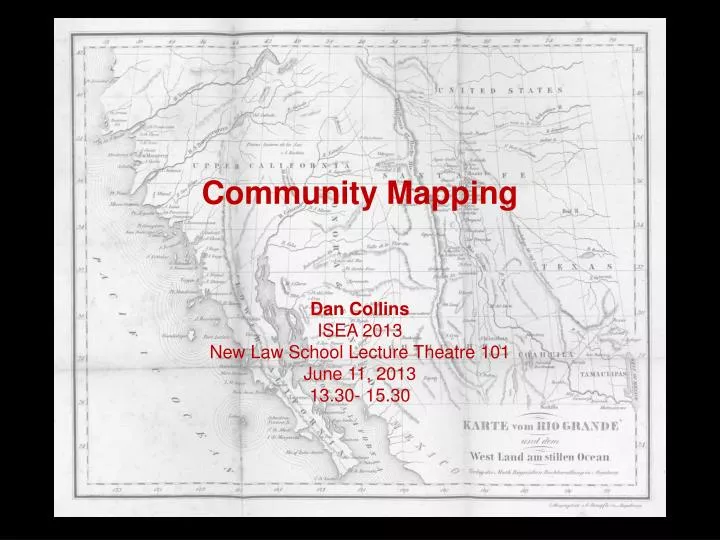
Community Mapping Dan Collins ISEA 2013 New Law School Lecture Theatre 101 June 11, 2013 13.30- 15.30.

E N D
Community Mapping Dan Collins ISEA 2013 New Law School Lecture Theatre 101 June 11, 2013 13.30- 15.30
Contour plot . Map of Paris by L. L. Vauthier (1874), showing population density by contour lines, the first statistical use of a contour map. This approach to representing multivariate data arose from the use of contour maps in physical geography showing surface elevation (first published in 1752 by Buache), which became common in the early 19th century. It was not until 1843, however, that this idea was applied to data, when Léon Lalanne constructed the first contour plot, showing the mean temperature, by hour of the day and by month at Halle (lower left). Lalanne's data formed a regularly-spaced grid, and it was fairly easy to determine the isolines of constant temperature. Vauthier generalized the idea to three-way data with arbitrary (x,y) values in his map of the population density of Paris. http://www.math.yorku.ca/SCS/Gallery/noframes.html
The Broad Street cholera outbreak was a severe outbreak of cholera that occurred near Broad Street (now renamed Broadwick Street) in Soho district of London, England in 1854. This outbreak is best known for the physician John Snow's study of the outbreak and his discovery that cholera is spread by contaminated water. This discovery came to influence public health and the construction of improved sanitation facilities beginning in the 19th century. Snow used a spot map to illustrate how cases of cholera were centered around a particular water pump. He also made a solid use of statistics to illustrate the connection between the quality of the source of water and cholera cases. The section of Snow's map representing areas in the city where the closest available source of water was the Broad Street pump circumscribed most cases of cholera.[3
This figure (showing the population of Sweden from 1750-1875 by age groups) by Luigi Perozzo, from the Annali di Statistica, 1880, is a very early example of a 3D stereogram. Perozzo's figure is also notable for being printed in color in a statistics journal, and in a way which enhances the perception of depth.
SiteNon-Site open limits closed limits series of points an array of matter outer coordinates inner coordinates subtraction addition indeterminate certainty determinate certainty scattered information contained information reflection mirror edge center someplace (physical) no place (abstraction) many one
For example, his latest project, which comes together in an installation for David Zwirner in Manhattan (his first solo gallery show in a decade, we are told by the New York Times), chronicles a 15-mile walk he took through Jerusalem with nothing other than a map and some leaky cans of green paint. His intention, following along a detailed indication of the “Green Line” according to the armistice after the 1948 Arab-Israeli War, was to trace the Green Line’s actual geography today with a bag full of paint cans dribbling a broken, confused, and somewhat inaccessible outline of where it should technically be observed. In a film Julien Devaux made of the walk, he is seen hiking down streets, through yards and parks, past military checkpoints and over rocky abandoned terrain, all relatively with ease and without much notice or harassment, surprisingly enough.
Yolanda Harris, 2012. http://yolandeharris.net/?nk_work=sun-run-sun-satellite-sounders
Mapping the London Underground • Harry Beck's 1933 diagram of the 7+ lines of the London Underground, although geographically inaccurate, provides a coherent overview of a complex system. (See map at upper left). • With excellent color printing, classic British railroad typography (by Edward Johnson), and, in the modern style, only horizontal, vertical, and 45 degree lines, the map became a beautiful organizing image of London. • For apparently quite a number of people, the map organized London (rather than London organizing the map). Despite 70 years of revision due to extensions of the Underground and bureaucratic tinkering (the marketing department wrecked the map for several years), the map nicely survives to this day. • Compare map from late 1920s at lower left.
Why Map? Where commuters run over Black children on the Pointes-Downtown Track. Source: Detroit Geographical Expedition and Institute in the 1960s
What is Community Mapping? Where commuters run over Black children on the Pointes-Downtown Track. Source: Detroit Geographical Expedition and Institute in the 1960s
Participatory GIS In this Participatory Geographic Information System (PGIS), local users in the City of Bradford, UK “tag” a map to indicate areas where there is a “fear of crime.” This input was translated into a series of “density maps” by researchers Andy Evans and Tim Waters at the University of Leeds (2004)
Backing up a bit…What is a GIS? (Geographic Information System) In-house versus Online… Screenshot of online GIS developed by San Miguel County planning office. Colored area demarcates extent of the County. Site uses ArcIMS (internet map server) protocols and is hosted by a Canadian company, GeoCortex. Note data layers at right.
What is a GIS? GIS = Geographic Information System The utility of “a GIS” is the result of combining spatial visualization and modeling applications with computerized databases. In other words, every “geo-coordinate” on the visual map is linked to a corresponding “cell” or “row” containing textual or numeric data in a spreadsheet. map (from ArcMap) database (from ArcCatalog)
A GIS is typically comprised of layers: Property Notable Locations Transportation Boundaries and Districts Wildlife Habitat Environment Land Use and Planning Recreation Topography and Aerial Photos
GIS versus PGIS A “GIS” is by definition exclusionary. It favors quantifiable description and systematic knowledge. It is a “top-down” process. A “Participatory GIS” is inclusive. It seeks out subjective qualities that may be missed by conventional mapping. It is a “bottom-up” process.
GIS versus PGIS • Essentially, a PGIS is meant to bring the academic and specialized practices of a GIS and mapping to the local level in order to promote knowledge production and access for community members. A key objective of a PGIS is the empowerment and inclusion of marginalized populations—those with little voice in the public arena (Sallings, cited in Wood, 2005, n.p.).
Online GIS maps Screenshot of online GIS developed by the author. Red outline shows San Miguel River watershed boundary. Green push-pins are hyperlinks to “cultural practices” (poems, photos, oral histories, etc.) selected, digitized, and linked by the author. For further information about the software, go to http://explorer.arcgis.com
Poetry with Geo-coordinates: Art Goodtimes The Wright Stuff Love it or leave itthe Rednecks say& I'm all roots & getting redderhere at Cloud Acrelooking south to Lone Cone. Willow buds thickin the highway barrow ditch.Late spring asparagus& bottle blue iris.Each nightlistening for the arpeggiowhistle of tailfeathersas the Wilson Snipesdo their loop-to-loop keeping us mosquito freeamid the irrigatedwetlands of Maverick Draw. … photo credit: Christine A.B. Odle
Mapping in Google Earth using Handhelds Prairie Dog Town on the Valley Floor, Telluride, Colorado Data set created by Brian Ian, a 9th grader in David Lavendar’s ISP program, Oct. 1, 2010
NOAH: Networked Organisms and Habitats Participatory map of species ID and location http://www.projectnoah.org
NOAH: Networked Organisms and Habitats Participatory map of species ID and location http://www.projectnoah.org
NOAH: Networked Organisms and Habitats Participatory map of species ID and location http://www.projectnoah.org
Tempe History Museum Interactive Map Interactive touch screen for the City of Tempe, Arizona’s History Museum supports “top down” mapping along side “bottom up” input from community members. (Dan Collins and Gene Cooper)
Tempe History Museum Interactive Map
Tempe History Museum Interactive Map
Tempe History Museum Interactive Map
Dan Collins and Gene Cooper: Bay Model: A Working PrototypeExploratorium, San Francisco, CA (permanent exhibit)
The Voice of the Farmers = sautiyawakulima.net Mutual learning, observation and community memory: networked communication tools for farmers in Bagamoyo, Tanzania. Project by Eugenio Tisselli, Juanita Schläpfer, and Angelika Hilbeck
The Voice of the Farmers = sautiyawakulima.net Mutual learning, observation and community memory: networked communication tools for farmers in Bagamoyo, Tanzania. Project by Eugenio Tisselli, Juanita Schläpfer, and Angelika Hilbeck
NO PLACES WITH NAMES - A Critical Acoustic Archaeology Teri Rueb and Larry Phan with contributions from Carmelita Topaha (Dine) Drawing visitors out into the landscapes surrounding the campus of the Institute for American Indian Art Institute in Santa Fe, this GPS-based sound walk and sculpture installation explores the concept of wilderness and its shifting meanings across cultural contexts. A spatialized sound composition created for the IAIA Dome offers an alternative mode for experiencing sounds drawn from the sound walk. An exhibition, staged as a visitor center, is presented at the Santa Fe Art Institute. The sound walk will premiere at ISEA 2012, opening on September 19 and will be released as a mobile app available for free download (making the work accessible beyond the dates of the exhibition). Terirueb.net
ICEBERG: Milan Mozari Augmented Reality project places digital sculpture in “real” sites Using Augmented Reality app Layar, this sculptural project aims to place digital object(s) (3D models) around campus. This is done through augmented reality and server communication. The digital sculpture is placed via GPS coordinates at specific sites, but visible through walls at great distances. The sculpture is not visible to the naked eye, but only available through the mediation of a smart phone or tablet. In this superimposition of digital sculpture, the viewer navigates through physical space to participate in an exchange system– the object revealing details as you get closer. This allows the viewer to personally orient oneself around the sculpture, and have an interaction that is both public and private.