Download
1 / 39
390 likes | 438 Views
Situation of Children and Women in India. Dr KANUPRIYA CHATURVEDI Dr S.K CHATURVEDI. India - 2001. Population 1027 million Children 0-14 350 million (34%) Children 0-6 158 million (15%). Source: Census, 2001. Uttar Pradesh Bihar Maharastra Madhya Pradesh West Bengal Andhra Pradesh

E N D
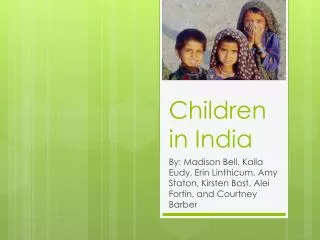
Situation of Children and Women in India Dr KANUPRIYA CHATURVEDI Dr S.K CHATURVEDI
India - 2001 Population 1027 million Children 0-14 350 million (34%) Children 0-6 158 million (15%) Source: Census, 2001
Uttar Pradesh Bihar Maharastra Madhya Pradesh West Bengal Andhra Pradesh Tamil Nadu Rajasthan Karnataka Gujarat Orissa Kerala Assam Pakistan Bangladesh Iran Vietnam Philippines Ethiopia Zaire Thailand Myanmar Tanzania Sudan Canada Iraq 60 40 20 0 20 40 60 Child population in millions India : The scale of things... Population: 1,027 million Children 0-18: 380 million (37%) Many states have child populations similar to large countries
Infant Mortality Rate, 2002 Maternal Mortality Ratio, 1998 India - 64 India - 540 Source: SRS October, 2003 Source: NFHS, 1998, SRS, 1998
IMR among Indian States: 2002 There is an 77 point difference between Orissa (87 per 1,000) and Kerala (10 per 1,000) Source: SRS October, 2003
… and within the states Infant Mortality Rate Source: Census, 1991
Per cent 20-30 Per cent 30-40 40-47 0-10 10-20 Above 20 Above 47 Low Birth Weight Malnutrition India : 47% (children moderately to severely underweight) India : 22% Source: MICS, 2000 Source: NFHS, 1998
HIV + U5MR Indicators of vulnerability
Disparities in school attendance • Children age 5-14 years currently attending school
Gender Bias- Sex Ratio • Total • 0-6 Years 1991 : 927 2001 : 933 1991 : 945 2001 : 927 Declining Child Sex Ratio Source: Census
Birth registration Only 35% births are registered
20 18 15 15 % of children aged 5-14 years working for someone else 10 8 5 4 5 3 2 2 2 2 0 Madhya Punjab Kerala Uttar Bihar Orissa India Rajasthan Tamil Nadu Andhra Pradesh Pradesh Pradesh Child Labour • 5% of children aged 5 -14 years in India work as child labourers working for someone else
Bihar 34 Uttar Pradesh 43 There is a 54 point differential between the highest and lowest state level female literacy rates Rajasthan 44 India 54 Tamil Nadu 65 Maharashtra 68 Kerala 88 30 40 50 60 70 80 90 100 % literate females (7+) Inter-state female literacy differentials: India 2001
Jammu & Kashmir Himachal Pradesh Chandigarh Punjab Uttaranchal Haryana Delhi Arunachal Pradesh Sikkim Uttar Pradesh Rajasthan Assam Nagaland Bihar Meghalaya Manipur Tripura Jharkhand Madhya Pradesh West Bengal Mizoram Gujarat Chhattisgarh Daman & Diu Orissa Dadra & Nagar Haveli Maharashtra Andhra Pradesh Goa Karnataka Pondicherry Lakshadweep Andaman & Nicobar Islands Tamil Nadu Kerala States implementing Juvenile Justice Act 2000
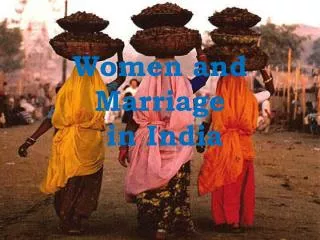
Early marriage • 65% of girls in India are married by the age of 18 • 33% are married by the time they are 15 years of age • Another 31% are married between 15 to 18 years of age
Urban Rural 548 683 846 1027 PROGRESS • Reduction in poverty (Millions) Urban Population (Millions)
90 80.1 80 75.6 72.2 70 65.2 63.2 59.2 60 54 51.5 50 1991 44 38.7 2001 40 30 20 10 0 Male Rural Total Female Urban PROGRESS • Increase in Literacy
PROGRESS • Decline in IMR Urban [Rural 69; Urban 40; Total 64] Rural
Goal 45 66 55 PROGRESS - TOO SLOW • Infant Mortality Rate, 1971-2007
There was good progress in infant mortality reduction during the 1980s ... … but progress has slowed since 1993. Slow progress in ... … reducing infant mortality Deaths per 1,000 live births
But better progress in ... … basic education ... School attendance rates (6-14 years) rose from 68% in 92-93 to 79% in 98-99 … and access to drinking water Households using improved drinking water sources: 83% Protected sources of drinking water : Handpump & Piped water
20 17 16 16 15 15 15 15 15 15 14 13 13 12 13 12 12 12 12 12 10 Defence % of Aggregate Expenditure Stagnation in social sector Social Services* Health and Family Welfare 5 Education 2 2 2 2 2 2 2 2 2 2 2 1 1 2 2 1 1 1 0 1993-94 1994-95 1995-96 1996-97 1997-98 1998-99 1999-00 2000-01 2001-02 (RE) (BE) * Includes food, subsidies, health, family welfare, education, rural development, urban development, welfare of SC/STs and other expenditures Expenditure - Social Sectors • Government Expenditures as % of aggregate expenditure
Reduction in poverty (Millions) Decline in IMR The polio campaign has had a dramatic impact ... [Rural 69; Urban 40; Total 64] Urban Rural Source: Economic Survey Population (Millions) Source: SRS October, 2003 548 683 846 1027 Increase in Literacy Source: Census, 1991 & 2001 Source: SEAR Polio Bulletin, WHO
Over 50% associated with malnutrition The right to survive :Global top child killers CDN Health Child Environ 17% Source: WHO, 1997
Distribution of Infant Deaths 62 % infant deaths occur within one month of birth Source: Sample Registration System
Underlying factors: malnutrition, hygiene, care practices 47% of children aged under three are malnourished. At the current rate of 1% reduction per year, there will still be 29 million malnourished children in 2015. 35% of households use a toilet. On current trends, only 75% of households will have toilets by 2025
Vaccination Coverage% of children fully immunised TN (95%) AP (63%) Gujarat (57%) INDIA (48%) MP (33%) UP (29%) Bihar (22%) Sources: CES, NFHS, MICS and RCH2
% Children not Received Any Vaccine by Selected Characteristics Standard of living Residence Education Source: RCH Survey, 2002
Underweight Among Children, 2002(2,23,084 children were covered) Source: RCH Survey, 2002
Underweight Among Children by State Source: RCH Survey, 2002
Anaemia Among Pregnant Women by State Source: RCH Survey, 2002
> 5% among high risk groups < 5% among high risk groups > 1% among pregnant women HIV/AIDS: A threat to survival, growth and development 1994 1998 2000 In 2001, there were 3.97 million people with AIDS.
Anaemia Among Adolescent Girls (1,71,645 girls aged 10 - 19 years) 5% 24% 28% 43% Source: RCH Survey, 2002
Key Points • Many states have child populations similar to large countries. • IMR continues to be high and is not commensurate with the economic growth of the country There is an 77 point difference between Orissa (87 per 1,000) and Kerala (10 per 1,000) and MMR is at a staggering high. • 22% of the children are low birth weight and 47% of the underfive are malnourished • There is decline in sex ratio and some of the states like Haryana , Punjab are the worst affected. * *
Key Points (contd.) • Only 35% of the births are registered. • 5% of children aged 5 -14 years in India work as child labourers working for someone else • There is a 54 point differential between the highest and lowest state level female literacy rate • 65% of girls in India are married by the age of 18. 33% are married by the time they are 15 years of age.Another 31% are married between 15 to 18 years of age