Download
1 / 23
230 likes | 358 Views
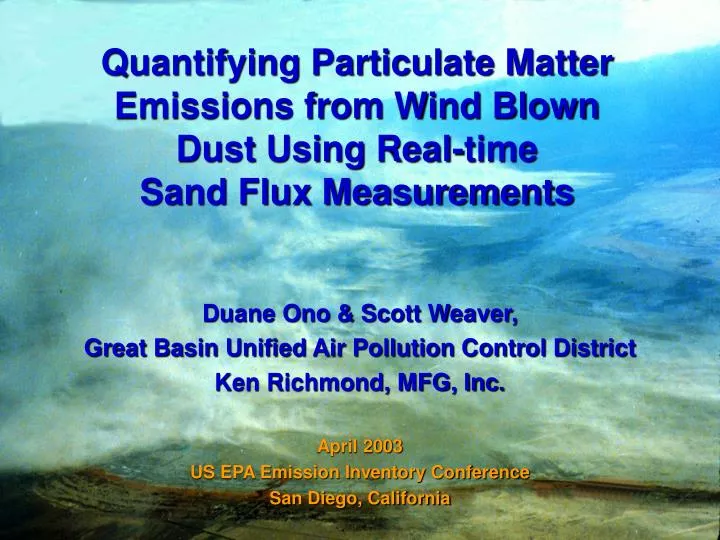
Quantifying Particulate Matter Emissions from Wind Blown Dust Using Real-time Sand Flux Measurements. Duane Ono & Scott Weaver, Great Basin Unified Air Pollution Control District Ken Richmond, MFG, Inc . April 2003 US EPA Emission Inventory Conference San Diego, California.

E N D
Quantifying Particulate Matter Emissions from Wind BlownDust Using Real-timeSand Flux Measurements Duane Ono & Scott Weaver, Great Basin Unified Air Pollution Control District Ken Richmond, MFG, Inc. April 2003 US EPA Emission Inventory Conference San Diego, California
Two Methods to EstimatePM-10 Emissions Due toWind Blown Dust • AP-42 method for Industrial Wind Erosion (Section 13.2.5) • Dust ID method developed at Owens Lake
AP-42 PM-10 Emissions e = PM-10 emission factor [g/m2/yr] k = 0.5 for PM-10 Pi = erosion potential corresponding to the ith period N = number of disturbances per year Pi = 58(ui*- ut*)2 + 25(ui*- ut*) [g/m2/period] Pi = 0, for ui* < ut* ui* = Friction velocity for the fastest mile [m/s] ut* = Threshold friction velocity
Dust ID Method Fa = Kf x q Fa = PM-10 emissions [g/cm2/hr] Kf = K-factor q = sand flux at 15 cm [g/cm2/hr]
Owens Lake Dust ID Monitoring Network135 sand flux sites6 PM-10 TEOM sites13 10-m met towersUpper air profilerTime-lapse camera sitesDust observer sites
Sand Flux Monitors Cox Sand Catcher - Collects saltation-size particles Sensit ™ - Electronically records sand flux.
K-factor Calculations Kf = Hourly K-factor Ki = Initial K-factor (5 x 10⁻⁵) Cobs.= Monitored hourly PM-10 Cbac.= Hourly background PM-10 Cmod.= Modeled PM-10 at monitor site
VISIBLE DUST PLUMES & SAND FLUXObserved dust plume locations corresponded to the hotspot areas identified by the sand flux monitoring network.Example Storm: Feb. 6-8, 2001(52 hour total)
PM-10 concentrations and sand flux were monitored for 30 months at Owens Lake.
Period Keeler Dunes North Area Central Area South Area 1/1/00-2/3/01 5.1 2.1 6.6 1.9 2/4/01-4/18/01 5.1 2.1 26.0 6.7 4/19/01-11/30/01 5.1 2.1 6.3 1.9 12/1/01-3/8/02 20.0 7.6 36.0 5.8 3/9/02-4/18/02 5.5 5.0 6.9 9.0 4/19/02-6/30/02 5.5 5.0 6.6 1.8 Temporal & Spatial K-factors
Dust ID Period Area Wind Tunnel Dust ID 1/1/00 - 2/3/01 North Area 2.3 x 10⁻⁵ 1.8 x 10⁻⁵ 1/1/00 – 2/3/01 Keeler Dunes 1.3 x 10⁻⁵ 3.5 x 10⁻⁵ 2/4/01 - 4/18/01 Central Area 9.7 x 10⁻⁵ 24.1 x 10⁻⁵ 2/4/01 - 4/18/01 South Area 6.6 x 10⁻⁵ 5.9 x 10⁻⁵ 4/19/01 - 11/30/01 Central Area 16.0 x 10⁻⁵ 5.7 x 10⁻⁵ 4/19/01 - 11/30/01 South Area 3.1 x 10⁻⁵ 2.0 x 10⁻⁵ Comparison of Wind Tunnel & Dust ID K-factors
Comparison of Hourly Monitored and Modeled PM-10 at Shell Cut, May 2-3, 2001
Owens LakePM-10 Emissions Peak Daily PM-10 = 7,200 tons Annual PM-10 = 79,200 tons Dust ID Period: July 2000 - June 2001.
Conclusions • PM-10 emissions due to wind erosion were found to be proportional to the saltation flux and could be estimated from measured sand flux. • Proportionality factors, or K-factors could be derived by comparing monitored PM-10 concentrations to modeled values using the measured sand flux with an initial K-factor. • Average K-factors were found to vary spatially and temporally at Owens Lake.