Download
1 / 43
430 likes | 526 Views
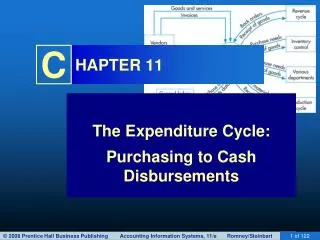
How do we track the booms and busts of the business cycle? How do we measure a nation’s production and income? How do we determine when a recession begins?. GDP, INCOME, AND EXPENDITURE. GDP Defined Gross domestic product or GDP

E N D
How do we track the booms and busts of the business cycle? • How do we measure a nation’s production and income? • How do we determine when a recession begins?
GDP, INCOME, AND EXPENDITURE • GDP Defined • Gross domestic product or GDP • The market value of all the final goods and services produced within a country in a given time period. • Value Produced • Use market prices to value production.
GDP, INCOME, AND EXPENDITURE • What Produced • Final good or service is a good or service that is produced for its final user and not as a component of another good or service. • Intermediate good or service is a good or service that is produced by one firm, bought by another firm, and used as a component of a final good or service. • GDP includes only those items that are traded in markets.
GDP, INCOME, AND EXPENDITURE • Where Produced • Within a country • When Produced • During a given time period.
GDP, INCOME, AND EXPENDITURE • Circular Flows in the U.S. Economy • Consumption expenditure is the expenditure by households on consumption goods and services. • Investment is the purchase of new capital goods (tools, instruments, machines, buildings, and other constructions) and additions to inventories.
GDP, INCOME, AND EXPENDITURE • Government expenditure on goods and servicesis the expenditure by all levels of government on goods and services. • Net exports of goods and servicesis the value of exports of goods and services minus the value of imports of goods and services.
5.1 GDP, INCOME, AND EXPENDITURE • Exports of goods and servicesare the items that firms in in the United States produce and sell to the rest of the world. • Imports of goods and services are the items that households, firms, and governments buy from the rest of the world.
5.1 GDP, INCOME, AND EXPENDITURE • Total expenditure is the total amount received by producers of final goods and services. • Consumption expenditure: C • Investment: I • Government expenditure on goods and services: G • Net exports: NX • Total expenditure = C + I + G + NX
GDP, INCOME, AND EXPENDITURE • Income • Labor earns wages. • Capital earns interest. • Land earns rent. • Entrepreneurship earns profits. • Households receive these incomes.
GDP, INCOME, AND EXPENDITURE • Expenditure Equals Income • Because firms pay out everything they receive as incomes to the factors of production, total expenditure equals total income. • That is: • Y = C + I + G + NX • The value of production equals income equals expenditure.
GDP, INCOME, AND EXPENDITURE Figure 1 shows the circular flow of income and expenditure. The table shows the U.S. data for 2009.
MEASURING U.S. GDP • The Expenditure Approach • Measures GDP by using data on consumption expenditure, investment, government expenditure on goods and services, and net exports. • Table 1 on the next slide shows the calculation for 2009.
MEASURING GDP Expenditures Not in GDP • Used Goods • Expenditure on used goods is not part of GDP because these goods were part of GDP in the period in which they were produced and during which time they were new goods. • Financial Assets • When households buy financial assets such as bonds and stocks, they are making loans, not buying goods and services.
MEASURING GDP • GDP and Related Measures of Production and Income • Gross national product orGNP is the market value of all the final goods and services produced anywhere in the world in a given time period by the factors of production supplied by residents of the country. • U.S. GNP = U.S. GDP + Net factor income from abroad
MEASURING GDP Disposable Personal Income Consumption expenditure is one of the largest components of aggregate expenditure and one of the main influences on it is disposable personal income. Disposable personal income is the income received by households minus personal income taxes paid.
MEASURING GDP • Real GDP and Nominal GDP • Real GDP is the value of the final goods and services produced in a given year expressed in the prices of the base year. • Nominal GDP is the value of the final goods and services produced in a given year expressed in the prices of that same year. • The method of calculating real GDP changed in recent years. Here we describe the essence of the calculation. The appendix gives the technical details.
MEASURING GDP • Calculating Real GDP • The goal of calculating real GDP is to measure the extent to which total production has increased • Real GDP removes the influence of price changes from the nominal GDP numbers. • To focus on the principles and keep the numbers easy to work with, we’ll calculate real GDP for an economy that produces only one consumption good, one capital good, and one government service.
MEASURING U.S. GDP • Table 3 shows the calculation with 2005 (base year) and 2010. • To find the total expenditure in 2005 multiply the quantity of each item produced in 2005 by its price in 2005. • Then sum the expenditures to find nominal GDP in 2005. • The next slide shows the data.
Nominal GDP in 2005 is $100 million. Because 2005 is the base year, real GDP in 2005 is also $100 million.
MEASURING U.S. GDP • In part (b) of Table 3, we calculate nominal GDP in 2010. • Again, we calculate nominal GDP by multiplying the quantity of each item produced by its price and then sum the expenditures to find nominal GDP in 2010.
Nominal GDP in 2005 is $100 million. Nominal GDP in 2010 is $300 million.
MEASURING U.S. GDP Nominal GDP in 2005 is $100 million and in 2010 it is $300 million. • Nominal GDP in 2010 is three times its value in 2005. • But by how much has the quantity of final goods and services produced increased?
MEASURING U.S. GDP • The increase in real GDP will tell by how much the quantity of good and services has increased. • Real GDP in 2010 is what the total expenditure would have been in 2010 if prices had remained the same as they were in 2005. • To calculate real GDP in 2010 multiply the quantities produced in 2010 by the price in 2005 and the sum these expenditures to find real GDP in 2010. • Part (c) of Table 3 shows the details.
Real GDP in 2005 is $100 million. Real GDP in 2010 is $160 million—only 1.6 times real GDP in 2005.
THE USE AND LIMITATIONS OF REAL GDP We use estimates of real GDP for three main purposes: • To compare the standard of living over time • To track the course of the business cycle • To compare the standard of living among countries • The Standard of Living Over Time • To compare living standards we calculate real GDP per person—real GDP divided by the population.
THE USE AND LIMITATIONS OF REAL GDP In 2009, U.S. real GDP was $12,893 billion and the U.S. population was 306.2 million. Real GDP per person = $12,893 billion ÷ 306.2 million Real GDP per person = $42,106. In 1959, real GDP per person was $15,540. The standard of living in 2009 was 2.7 times the standard of living in 1959.
THE USE AND LIMITATIONS OF REAL GDP Two features of our changing standard of living are • The growth of potential GDP per person • Fluctuations of real GDP per person around potential GDP Potential GDPis the value of real GDP when all the economy’s factors of production —labor, capital, land, and entrepreneurial ability—are fully employed.
THE USE AND LIMITATIONS OF REAL GDP When some factors of production are unemployed, real GDP is less than potential GDP. When some factors of production are over-employed and working hard, real GDP exceeds potential GDP. In the short term, real GDP fluctuates around potential GDP. To measure the trend in the standard of living, we remove the influence of short-term fluctuations and focus on potential GDP. Figure 3 on next slide shows these two features.
THE USE AND LIMITATIONS OF REAL GDP • Real GDPper person grows and fluctuates around the path of potential GDP. • Potential GDP per person grew at 2.8 percent in the 1960s and slowed during the 1970s.
THE USE AND LIMITATIONS OF REAL GDP • Tracking the Course of the Business Cycle • Fluctuations in the pace of expansion of real GDP is called the business cycle. • The business cycle is a periodic irregular up-and down movement of total production and other measure of economic activity. • The four stages of a business cycle areexpansion, peak, recession, and trough.
THE USE AND LIMITATIONS OF REAL GDP The shaded periods show the recessions—periods of falling production that lasts for at least six months.
EYE on the BUSINESS CYCLE How Do We Track the Booms and Busts of the Business Cycle? The National Bureau of Economic Research (NBER) Business Cycle Dating Committee determines the dates of U.S. business cycle turning points. To identify the date of a business cycle peak, the NBER committee looks at data on industrial production, total employment, real GDP, and wholesale and retail sales. The two most reliable measures of aggregate domestic production are real GDP measured using the expenditure approach and the income approach.
EYE on the BUSINESS CYCLE How Do We Track the Booms and Busts of the Business Cycle? The NBER committee met in November 2008 to determine when the economy went into recession. Because of a statistical discrepancy, the two estimates of real GDP differ and for a few quarters in 2007 and 2008 they told conflicting stories. The NBER examined other data on real personal income, real manufacturing, wholesale and retail sales, industrial production, and employment.
EYE on the BUSINESS CYCLE How Do We Track the Booms and Busts of the Business Cycle? All of these data peaked between November 2007 and June 2008. The committee decided that November 2007 was the peak. But as the figure shows, real GDP didn’t begin a sustained fall until two quarters later.
THE USE AND LIMITATIONS OF REAL GDP • Standard of Living Across Countries • To compare living standards across countries, we must convert real GDP into a common currency and common set of prices, called purchasing power parity. • Goods and Services Omitted from GDP • Household production • Underground production • Leisure time • Environment quality
THE USE AND LIMITATIONS OF REAL GDP • Household Production • Real GDP omits household production and it underestimates the value of the production of many people, most of them women. • Underground Production • Hidden from government to avoid taxes and regulations or illegal. • Because underground economic activity is unreported, it is omitted from GDP.
THE USE AND LIMITATIONS OF REAL GDP • Leisure Time • Our working time is valued as part of GDP, but our leisure time is not. • Environment Quality • Pollution is not subtracted from GDP. • We do not count the deteriorating atmosphere as a negative part of GDP. • If our standard of living is adversely affected by pollution, our GDP measure does not show this fact.
THE USE AND LIMITATIONS OF REAL GDP • Other Influences on the Standard of Living • Health and Life Expectancy • Good health and a long life do not show up directly in real GDP. • Political Freedom and Social Justice • A country with a large real GDP per person might have limited political freedom and social justice. • A country with a lower standard of living might be one in which everyone enjoys political freedom.
APPENDIX: MEASURING REAL GDP • The Problem with Base-Year Prices • We calculated real GDP in 2010 using 2005 as the base year and found that real GDP in 2010 was 1.6 percent greater than in 2005—an increase of 60%. • But if we had used 2010 prices rather than 2005, real GDP would have increased from $150 million (2010 dollars) in 2005 to $300 million in 2010—an increase of 100%. • So did real GDP increase by 60% or 100%?
APPENDIX: MEASURING REAL GDP • The BEA method uses the prices of both years. • The three steps in the method are • Value production in the prices of adjacent years. • Find the average of the two percentage changes. • Link (chain) to the base year.
APPENDIX: MEASURING REAL GDP • By applying the average percentage change between each pair of years, we find the chained-dollar real GDP for each year, expressed in terms of 2005 dollars. • We can do this for years after the base year, • And for years earlier than the base year.