Download
1 / 33
330 likes | 518 Views
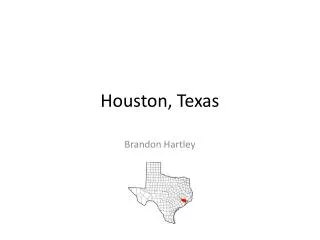
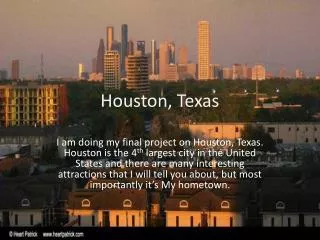
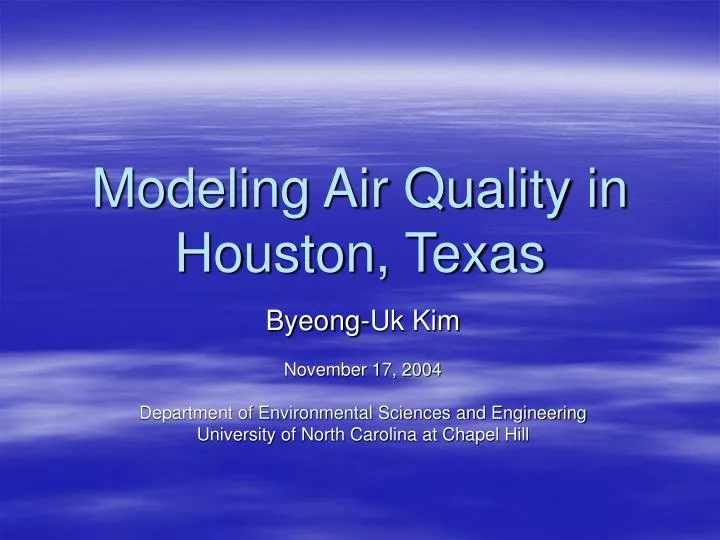
Modeling Air Quality in Houston, Texas. Byeong-Uk Kim November 17, 2004 Department of Environmental Sciences and Engineering University of North Carolina at Chapel Hill. Content. Background Uniqueness of Houston Air Quality Modeling for Houston Dissertation. Background.

E N D
Modeling Air Quality in Houston, Texas Byeong-Uk Kim November 17, 2004 Department of Environmental Sciences and Engineering University of North Carolina at Chapel Hill
Content • Background • Uniqueness of Houston • Air Quality Modeling for Houston • Dissertation
Background • Is ozone bad or good? • Ozone formation science • Non-attainment area and State Implementation Plan (SIP) • Difficulties in developing control strategy • Non-linearity • Ozone transport • Photochemical Air Quality Modeling (PAQM) system
Is ozone bad or good? http://www.epa.gov/oar/oaqps/gooduphigh/
Ozone formation science Jeffries, 1993
Ozone formation science • Where do we get the precursors? • NOx (=NO+NO2) • Automobiles • Power plants • VOCs (Volatile Organic Compounds) • Automobiles • Refineries • Trees • Other area sources
Non-attainment and SIP • Non-attainment area • NAAQS for ozone: daily maximum one hour average concentration < 0.12 ppm • fourth highest reading in 3 years => 125 ppb is a violation at that monitor • highest violation in 3 years is the “design value” for control • State Implementation Plan (SIP) • Control strategy development • Attainment demonstration NAAQS: National Ambient Air Quality Standards
Difficulties in developing control strategy: Non-linearity Philadelphia Chicago Blanchard and Reynolds, 2002
Difficulties in developing control strategy: Ozone transport ~100km Travel in 6 hrs ~100km between New York City- Philadelphia
Formulation of PAQM Jeffries, 1993
Operation of PAQM TCEQ developed 9114 new emission point speciation profiles From Byun, UH
Reported EI • Normal Non-EGU VOC EI with Special EI additions • hg_02km.tx_negu_si4a Total Point Source CB−IV HC Emissions, 08/25/2000 Base inventory of 240 T/D Nearly constant emissions TCEQ Cantu, 2002
SIP modeling Base case – explain current ozone with current inventory Future case – predict ozone with growth and existing regulations. Future controlled case – predict ozone with growth, existing regulations, and newly proposed regulations. All three cases use the same episodic meteorology. From Byun, UH
Uniqueness of Houston • Transient High Ozone Events (THOEs) • Large variability of VOC emissions • Different Modeling Approach Needed • Complex meteorological conditions
Transient High Ozone Event in Houston Jeffries, 2004
>10,000 lbs/hr ethylene release at La Porte, (6700 lbs between 11:00 AM and 11:25 AM) 3/27/2002
Large Variability of VOC Emissions • Permitted emission components • Nearly Constant • Routinely Variable • Allowable Episodic • Off-permit event emission releases • Start-up, shut-down, maintenance operations, accidents, emergencies • Subject to RQ value Webster, 2003
Different Modeling Approach Needed • Typical conceptual model • New conceptual model Jeffries, 2003
Complex Meteorological Conditions http://www.islandnet.com/~see/weather/elements/seabrz.htm
Complex Meteorological Conditions GOES: Geostationary Operational Environmental Satellites
Complex Meteorological Conditions August 31, 2000 Estimated Mixing Height by Kv profile 10:00 AM 02:00 PM 06:00 PM Land/sea breeze does not happen clearly all the time. The synoptic weather pattern plays a key role.
Air Quality Modeling for Houston • Modeling Domain • General Description • Base case results • Future case results
Air Quality Modeling for Houston • UNC Beowulf servers • More than 150 nodes, MPI support • CAMx (Comprehensive Air quality Model with eXtensions Ver. 4.x) • Serial/OpenMP • Modeling period • August 22, 2000 ~ September 6, 2000 • Run statistics • About 4 hours clock time for an episodic day on an Intel 2.8GHz CPU node • About 2 GB size of outputs per episodic day
Base case results Imputed base Not imputed (max 112 ppb) + Event
Future case results Without Event + Imputed future With Event + Imputed future
Dissertation • Does this model show or have all necessary components to produce the phenomena that we can expect from the current best perceptual/conceptual model? • Can this model distinguish what precursor to control for ozone reduction? • Does it estimate the control requirement unambiguously? • What are the possible biases in the prediction and its impact on the policy choice? The answers to these questions may vary spatially over the modeling domain and temporally during the modeling period.
Why do we care those questions? • The current SIP framework requires the use of PAQM for the control strategy developments. • Once developed, the control strategies will influence our daily life. Some of them are also very expensive to implement. • Highway speed limit change • Restriction of the construction equipments • Installation of NOx control device • It may consume all important material for the device that is available in the USA to make the demanded amount of devices for a region. • What if these are not the primary reason for the ozone violation in your area?
Lots of analysis and tools • Model performance analysis • Potential reliability of the modeling results for the policy use • Area of influence analysis • Source-receptor relationships • Uncertainty/Sensitivity analysis • Identification of the important process/parameter/input • Process analysis • Model’s internal ozone concentration by process contributions