Download
1 / 23
240 likes | 426 Views
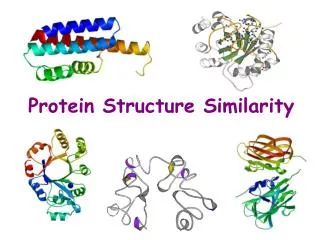
Protein Sequence- and Structure-based Similarity Networks. Ioannis Valavanis 1 , George Spyrou 2 , Konstantina Nikita 1 1 Biomedical Simulations and Imaging Laboratory, School of Electrical and Computer Engineering, National Technical University of Athens, Greece

E N D
Protein Sequence- and Structure-based Similarity Networks Ioannis Valavanis1, George Spyrou2, Konstantina Nikita1 1Biomedical Simulations and Imaging Laboratory, School of Electrical and Computer Engineering, National Technical University of Athens, Greece 2Biomedical Research Foundation of the Academy of Athens, Greece Department of Informatics and Communications, University of Athens, Greece Athens, May 7th, 2008
Introduction • Construction of Similarity Networks • Analysis of Similarity Networks • Conclusions • Future Work Outline
Networks and Real World Systems • Network: Set of vertices (elements of system) and edges (interrelations between elements) • Each real world system can be described by a Network • Biological and Chemical Systems • Social Interacting Species • Computer Networks and Internet • Quantification of a Network (N vertices, K edges) reveals information on the System • Network Degree k=2K/N • SparsityS = 2K/(N(N-1)) • Centrality measurements of each vertex (degree of a vertex, betweeness of a vertex) • Randomness or Regularity based on average minimum path length (L) and clustering coefficient (C) • Most real world systems behave like Small World Networks (SWNs) (Strogatz, 2001) • Few vertices (hubs) dominate the network activity (Barabasi 2003) inSWNs • Some known SWNs: • Film Actors • Peer to Peer Network • Metabolic Network • Yeast Protein Interactions • Functional Cortical Connectivity Network a) Regular: Great L and C b) Small World Network: Small or intermediate L and great C c) Random: Small L and C
Network-based description of Proteins • Folded proteins were transformed to networks (Vendruscolo et al., 2002; Greene and Higman, 2003) • vertices: residues • edges: given a distance criterion • Protein Network: SWN • Residue closeness in residue interaction graphs identified functional residues (Amitai et al., 2004) • Similarity proteins networks were constructed and affinity of a protein in the network classified the protein in superfamily, family and fold level(Camoglu et al., 2006) • Structural similarity network of representative proteins of folds was shown to be a SWN (Sun et al., 2006)
Current Study • Quantify the structure of both protein sequence and structural similarity networks for several criteria • Compare protein sequence and structural similarity network at same sparsity • Find hubs in protein sequence and structural similarity network and their biological significance • Extend results to “fold” sequence and structural similarity networks • Assess the information level of sequence-derived features in comparison with structures in terms of fold and class assignment
Protein Sequence Similarity Network • Well defined and used dataset of 311 sequences organized in fold and class level (Ding and Dubchak, 2001) • 27 popular folds • 4 classes (α, β, α/β, α+β) • Each sequence is represented by 125 sequence derived features (Dubchak et al., 1999) • Amino Acid Composition (20 features) • Predicted Secondary Structure (21 features) • Hydrophobicity (21 features) • Normalized van der Waal volumes (21 features) • Polarity (21 features) • Polarizability (21 features) • Each sequence is a vertex in the network • An edge occurs between 2 vertices given that the Euclidean distance of is lower than a threshold (dist ≤2.45, dist ≤ 2.1, dist ≤ 1.9, dist ≤ 1.6)
Protein Structural Similarity Network • Search of all proteins of the sequence data set in the Protein Data Bank (296 fully submitted structures found) • Each protein is represented by its 3-dimensional structure (3D coordinates of all atoms) • Structural similarity is given by the Z-score of structural alignment using DALI (Holm and Park, 2000) • Z > 0 some similarity is found • Z ≥ 2 significant similarity is found (Sun et al., 2006; Getz et al., 2004) • Each protein structure is a vertex in the network • An edge occurs between 2 vertices given a Z-score of Structural Similarity (Z >0, Z≥1, Z≥2)
Quantification of Similarity Networks • For each Network (N vertices, K edges) we calculated: • network degree k=2K/N • Sparsity S=2K/(N(N-1)) • fraction of all finite paths • Isolated vertices • For each network, we got its fully connected version by removing isolated vertices • Network parameters were calculated once again
Quantification of Similarity Networks • Results • Interconnectivity keeps mostly high the fraction of finite paths even on networks with low S and k • Consecutive similarity transitions connect even distant proteins on networks • Interconnectivity is found more in structural level • The harder the similarity criterion gets, the sparser is the network and more isolated vertices are found • We have to remove less isolated vertices in structural level to get fully connected networks
Protein Similarity Networks Adjacency Matrices • Depiction of adjacency matrices of 2 networks of almost same S~8-9% (dist≤1.6 (a), Z≥2 (b)) • Dense rectangles along diagonal correspond to clustered proteins (classes and folds) • Clustering is more obvious in structural level • High clustering within α/β class is obvious on both networks • Single dots far from diagonal correspond to random edges between proteins of different classes or folds Are Protein Similarity Networks SWNs?
Are Protein Similarity Networks SWNs? • We calculated L and C values for protein similarity networks λijis the minimum path between verticesi,j Niis the number of neighbors of vertexi Kiis the number of edges among neighbors of vertexi • L and C values were compared with the L and C values of random and regular networks of same S and N (Vendruscolo et al., 2002) Lrandom = ln(N)/ln(k) Crandom=k/N Lregular=N(N+k-2)/[2k(N-1)] Cregular=3(k-2)/[4(k-1)] • Results • Similarity Networks have a intermediate L and great C and are SWNs `
Interrelations between and within Folds and Classes • The level of interconnectivity between and within folds and classes is studied • Comparison between sequence and structural similarity networks of same sparsity • Sequence Similarity network (dist≤1.6) • Structural Similarity network (Z≥2) • Information of sequence and structure is assessed in terms of fold and class discrimination • Index used - FAPE (%): Fraction of All Possible Edges that occur Ni is the number of proteins in foldi , (1≤i≤27) Ei,jis the number of edges between foldsiand j(1≤i,j≤27) (1≤i,j≤4)
FAPE values FAPEfold values (a) and FAPEclass values (b) for the sequence similarity network (dist≤1.6) FAPEfold values (c) and FAPEclass values (d) for the structure similarity network (Z≥2) • Structures autocorrelate very well on fold and class level • Little structural similarity exists between different classes • Sequences autocorrelate less than structures in fold level • There is more similarity between sequences of different folds than structures (confirmed by sign-test for pairwise comparison, p<0.01) Interrelations between and within Folds and Classes
FAPE values FAPEfold values (a) and FAPEclass values (b) for the sequence similarity network (dist≤1.6) FAPEfold values (c) and FAPEclass values (d) for the structure similarity network (Z≥2) • Sequences include noise when used for fold and class assignment • Class α/β causes much interconnectivity within sequences and structures • Some folds offer more interconnectivity than others and may dominate the network activity • Fold 27 (small inhibitors, toxins, lectins) has the most internal dissimilarity and with other folds Interrelations between and within Folds and Classes
Graphivz(Gansner and North, 2000) (a) protein sequence similarity network (dist≤1.6), (b) protein structural similarity network (Z≥2) Light grey, dark grey, black and white spheres correspond to α, β, α/β and α+β class • The clustering of structures is very obvious • Even isolated structures are found in groups • Folds are connected directly or indirectly in structural level • Similarity transition and some clustering appears within sequences, as well • Sequence similarity network is more confusing Graphical Representation of Protein Similarity Networks • The SWN hosts the similarity transition during evolution • Isolated vertices are the result of serious alteration during evolution
Are there any hubs in the Protein Similarity Networks? • Betweenness (%) was measured for each vertex i , σst(i) is 1 if the shortest path between vertices s, t passes through vertex i, otherwise is 0 • High betweenness characterizes the vertices that dominate the network activity • Betweenness values are plotted in descending order for all vertices in protein sequence and structure similarity networks • solid line: Structures • dashed line: Sequences • Only few vertices dominate the network activity and function as hubs. Which are they and their biological meaning? Let’s see to which folds they belong to! - ! But first let us construct the “fold” similarity networks ! -
Fold Similarity Networks • Two folds are connected in sequence or structural level given that at least two vertices satisfy the similarity criterion (dist≤1.6, Z≥2) (a) fold sequence similarity network (dist≤1.6), (b) fold structural similarity network (Z≥2) • Light Grey, dark grey, black and white spheres correspond to α, β, α/β and α+β class • Clustering is more obvious in structural level • α/β class contributes more to the interconnectivity • Few folds are found totally isolated • Betweenness of folds were found and combined with betweenness of proteins
Betweenness Measurements in Similarity Networks - Hubs • α/β class contains more structures hubs than other classes • α/β proteins have many neighbors in networks that may have evolved from them • In accordance with that α/β class is the most ancestral one! (Caetano-Anollés et al, 2003 ) • α/β proteins mediate the similarity transition, e.g. within the β α/β α evolution pathway • (Grishin, 2001) • Folds of high betweeness (Globin-like, OB-fold, FAD-(also NAD)-binding motif, Ferrodoxin- like) in structural level have been reportedas more ancestral (Caetano-Anollés et al, 2003) • Similar results on betweenness were obtained in sequence level (α/β class, Globin-like fold)
Conclusions • High interconnectivity was found in both sequence and structural similarity networks • Similarity transition and interconnectivity is more obvious in structural level and appears due to evolution • Both networks were classified as SWNs, like other real-world systems • Hubs were found and related to the ancestrality of proteins/folds • Comparison of protein sequence and structure similarity networks at same sparsity showed commonalities: • Interconnectivity due to α/β class and certain folds • Clustering in folds and classes • Isolated folds on both levels and differences: • More clustering in structural level • More interrelation of different folds and classes in sequence level The source of noise in sequences when used for fold and class assignment is obvious • The information quality of sequence derived features is still to be studied and optimized
Future Work • Assess the quality of each of subsets of sequence-derived features used here, e.g. using graph similarity metrics between the two networks • Extend the pool of used sequence-derived features and optimize the features to use on a global network basis • Build as similar as possible protein similarity networks on sequence and structure level • Proceed to fold and class assignment using the sequence information in the optimized sequence similarity network, e.g. using graph-based classifiers
Literature Vendruscolo,M., Dokholyan,N.V. Paci,E. and Karplus,M. (2002) Small-world view of the amino acids that play a key role in protein folding. Phys. Rev. E. 65, id.: 061910. Barabasi AL. Linked: How everything is connected to everything else and what it means. New York: Plume Books; 2003. Greene,L.H. and Higman,V.A. (2003) Uncovering Network Systems Within Protein Structures. J. Mol. Biol., 334, 781-791. Amitai,G. et al.(2004) Network Analysis of Protein Structures Identifies Functional Residues. J. Mol. Biol., 344, 1135-1144. Camoglu,O., Can,T., Singh,A.K. (2006) Integrating multi-attribute similarity networks for robust representation of the protein space. Bioinformatics, 22, 1585 - 1592. Sun,Z.B., Zou,X.W., Guan,W. and Jin,Z.Z. (2006) The architectonic fold similarity network in protein fold space. Eur. Phys. J. B, 49, 127-134. Ding, C.H.Q and Dubchak,I. (2001) Multi-class protein fold recognition using support vector machines and neural networks. Bioinformatics, 7, 349–358. Dubchak et al. (1999) Recognition of a protein fold in the context of the Structural Classification of Proteins (SCOP) classification. Proteins, 35, 401-407. Holm,L. and Sander,C. (1994) Protein structure comparison by alignment of distance matrices. J. Mol. Biol., 233, 123-138 Strogatz,S.H. (2001) Exploring complex networks. Nature, 410, 268–276 Gansner,E. and North,S. (2000) An open graph visualization system and its applications to software engineering. Softw, Pract. Exper., 30, 1203-1233.Getz,G., Starovolsky,A. and Domany,E. (2004) F2CS: FSSP to CATH and SCOP prediction server. Bioinformatics, 20, 2150-2152. Caetano-Anollés G., Caetano-Anollés D. An evolutionarily structured universe of protein architecture. Genome Res 2003;13:1563-1571. Grishin NV. Fold change in evolution of protein structures. J Struct Biol 2001;134:67-185.
THANK YOU!!!! QUESTIONS? COMMENTS? (ivalavan@biosim.ntua.gr) ____________________________________________ Visit www.bibe2008.org for details on 8th IEEE International Conference on BioInformatics and BioEngineering (Athens, 8 - 10 October 2008) (Paper Submission deadline: 15/6/2008)