Download
1 / 15
150 likes | 153 Views
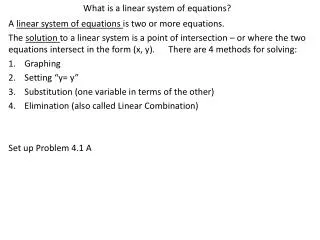
Dr. Fowler CCM Graphing Linear Equations Point slope x & y intercepts Pick 3 points. Line ar means of a line. So a linear equation is the equation of a line. In linear equations, all variables are to the first power. is linear. Parts of a Coordinate Plane. QUADRANT II (-x, y).

E N D
Dr. Fowler CCM Graphing Linear Equations • Point slope • x & y intercepts • Pick 3 points
Linear means of a line. So a linear equation is the equation of a line. In linear equations, all variables are to the first power. is linear.
Parts of a Coordinate Plane QUADRANT II (-x, y) QUADRANT I (x, y) Origin QUADRANT III (-x, -y) QUADRANT IV (x, -y) X-Axis Y-Axis
Graphing Ordered Pairs on a Cartesian Plane Write the Steps:1) Begin at the origin y-axis 2) Use the x-coordinate to move right (+) or left (-) on the x-axis 3) From that position move either up(+) or down(-) according tothe y-coordinate Origin (6,0) x- axis 4) Place a dot to indicate a point on the plane Examples: (0,-4) (6, 0) (-3,-6) (0,-4) (-3, -6)
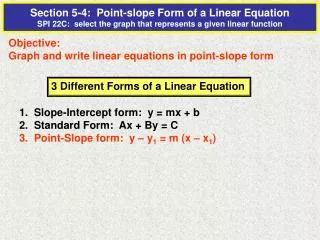
Slope-Intercept Form y = mx + b m = slope b = y-intercept Graph using slope & y-intercept
Standard Form ax + by = c Graph using x & y intercepts
Graphing with slope-intercept -3 • Start by graphing the y-intercept (b = 2). • From the y-intercept, apply “rise over run” using your slope.rise = 1, run = -3 • Repeat this again from your new point. • Draw a line through your points. 1 -3 1 Start here
Review: Graphing with intercepts: -2x + 3y = 12 • Find your x-intercept: Let y = 0 -2x + 3(0) = 12 x = -6; (-6, 0) • Find your y-intercept: Let x = 0 -2(0) + 3y = 12 y = 4; (0, 4) 3. Graph both points and draw a line through them.
Function - Input-Output Machines • We can think of equations as input-output machines. The x-values being the “inputs” and the y-values being the “outputs.” • Choosing any value for input and plugging it into the equation, we solve for the output. y = -2x + 5 x = 4 y = -2(4) + 5 y = -3 y = -8 + 5 y = -3
Ex: Graph 6x – 3y = 3 Solve for a variable: y x y = 2x - 1 y 6x – 3y = 3 0 y = 2(0) - 1 -1 -6x -6x 1 y = 2(1) - 1 1 - 3y = 3 – 6x -3 -3 ½ y = 2(½) - 1 0 y = - 1 + 2x y = 2x - 1 We have identified 3 solutions to the equation: (0, -1) (1, 1) ( ½ , 0)
Plotting the three solutions/points we get: (0, -1) (1, 1) ( ½ , 0) The solution points lie on a straight line. Every point on this line is a solution to the equation 6x – 3y = 3! 1 1
Special Cases for Lines: Special Case 1): Graph 7x + 63 = 0 7x = - 63 x = - 9 x is always – 9 this is a vertical line 3 3
Special Case 2) Graph 12y = 48 12y = 48 y = 4 y is always 4 * this is a horizontal line 3 3
Stop Notes Do Worksheet