Download
1 / 3
30 likes | 101 Views
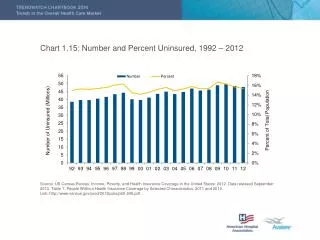
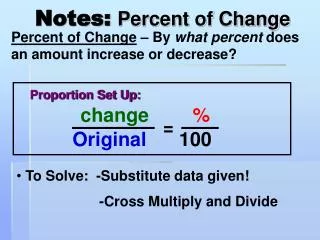
Percent with chart notes Thurs/Fri 3/6,7. Percents with Chart and Multiple Responses HW A representative sample of 9 0 students from OPMS is surveyed. Each student is asked which Math class he or she is taking. This table shows the responses.

E N D
Percents with Chart and Multiple Responses HW A representative sample of 90 students from OPMS is surveyed. Each student is asked which Math class he or she is taking. This table shows the responses. Math Teacher # of Students Hall10 McCreary18 Ballew14 Yuhl20 Helmich28
Based on the representative samples: True False • Three times as many students are taking • Helmich’s class than are taking Ballew’s class. X • 20% of students at OPMS are X • taking Hall’s class. • In a group of 35 students, it is expected that • 10 of the students are taking Yuhl’s class. X • In a group of 140 students, it is expected that X • 40 of the students are taking McCreary’s class.