Download
1 / 28
280 likes | 283 Views
This study presents a 2-D model of tsunami generation in a compressible water column overlying a porous sea bed, focusing on the acoustic wave induced by sea floor motion. The results provide insights into the pressure and velocity fields in the water column and porous sediment, as well as the characteristics of the acoustic wave. The study demonstrates that acoustic waves generated by sea floor motion can travel outside the source area with small attenuation, providing information about the impending tsunami. The study also explores the effect of porous sediment on damping and high frequency smoothing.

E N D
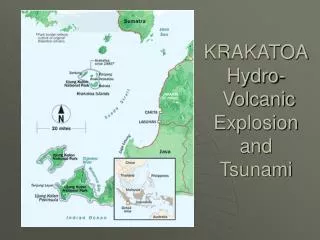
MODELLING OF THE HYDRO-ACOUSITC SIGNAL AS A TSUNAMI PRECURSOR F. Chierici (IRA-INAF)L. Pignagnoli (ISMAR-CNR) D. Embriaco (INGV) Nearest meeting, Berlin 9-10 October 2008
Outline 1) 2-D model of tsunami generation in compressible water column overlying a porous sea bed 2) Results, in particular concerning the acoustic wave induced within the water column by the sea floor motion 3) Conclusions
1. MODEL a) 2-D (x-z reference frame) Sea Water Column – Sediment Layer interaction b) Compressible water layerof height h c) Porous sea bed of height hs d) Small Amplitude waves: the wave amplitude x is negligible with respect to the wavelength. x/h << 1. Kinetic Energy << Potential Energy e) No Sea Water Viscosity => (Potential Flow)
in WATER COLUMN we use Navier-Stokes equations for a compressible fluid intoSEDIMENT we use Darcy equations for porous medium
Where: Fluid Velocity WATER COLUMN Fluid Pressure POROUS MEDIUM Discharge Velocity Fluid Pressure (into sediment) m is the dynamic viscosity, Kp is the intrinsic permeability and n is the volumetric porosity, r is the fluid density and g is the gravity acceleration
EQUATIONS OF MOTION: Sea Water Column: Mass Conservation Linearized Bernoulli equation c is the sound speed
BOUNDARY CONDITIONS: Free Surface (z = 0): Linearised Bernoulli equation Kinematic condition
BOUNDARY CONDITIONS: Sea Water – Sediment Bed interface (z = -h): Stress Continuity Vertical velocity continuity
BOUNDARY CONDITIONS: SedimentBottom : Non-permeability condition h is the sea floor displacement (/ h << 1)
We use and combine different kind of sea floor motions to model both permanent displacement and elastic oscillation. Duration, phase, amplitude and different kind of motion are employed together in order to obtain a wide typology of sea floor motion. Sea floor displacement is intended as visco-elastic deformation (assuming volume conservation of the porous layer and non permeability of the bottom of the sediment: i.e. z < -(h+hs) )
Basic Sea Floor Motions (each motion can be either negative or positive polarized and due to linearity they can be composed with different periods, amplitudes and phases): Time Space Permanent Displacement + Positive Elastic Motion (no permanent displacement) + Elastic Oscillation (no permanent displacement)
Semi-Analytical Solution by transforming x spatial variable with Fourier and t time variable with Laplace
where with k wave number and ω angular velocity A(ω, k), B(ω, k), C(ω, k) and D(ω, k) are the functions obtained imposing the boundary conditions. For example B is given by the following espression and
Model of Sea Floor Permanent Displacement Fourier (x => K) + Laplace (t => ω) : time duration of the sea floor motion 0: amplitude of the sea floor motion a: semi-length of the source area
The sea floor elastic motion can be obtained combining permanent displacement with the time-shift operator + The pressure field at fixed depth can be easily related to the free surface solution + The solution, corresponding to the elastic motion, can be easily related to the one obtained for the permanent displacement Hence it is sufficient to solve the problem for the free surface and permanent displacement only
2. RESULTS • The solved model allows us to study: • Thepressure and velocity fields (in the water column and in the porous sediment) • The free surface signal(from the velocity vertical component at the air-water interface) • at different distances from the source.
We will show that acoustic waves are generated by sea floor motion and travel outside the source area at sound speed (here assumed equal to c = 1500 m/s), well preceding the arrival of the tsunami wave, which travels at a lower speed. These waves carry information about sea floor motion and can propagate far from the source with small attenuation. The acoustic wave period depends on water height at the source area and is given by four times the time the sound takes to reach the sea surface from the sea bottom Ta = 4 h / c ; freq. = 0.05 ÷ 1 Hz for h = 400 ÷ 8000 m.
Free surface plot at 100km (a), 200km(b), 300km (c) and 1000km (d) distance from the source. 0 = 1m. a = 60 km. = 25 sec. h = 3 km. hs = 1.5 km. n = 0.3 kp = 10-6 cm2
Free surface plot at 300 km. from the source for different source length: 30km (a), 60km(b), 90km (c) 0 = 1m. = 1 sec. h = 1.5 km. hs = 0.75 km. n = 0.3 kp = 10-6 cm2
Free surface plot at 300 km. from the source for different source velocity: 1 m/s (a), 0.2 m/s (b), 0.1 m/s (c) 0 = 1m. h = 1.5 km. hs = 0.75 km. n = 0.3 kp = 10-6 cm2
“RESONANT” CASE: Free surface plot for different source time duration: 4 s (a), 8 s (b), 12 s (c) , 16 s (d) = n (4h/c) n = 1,2,… 0 = 1m. h = 1.5 km. hs = 0.75 km. n = 0.3 kp = 10-6 cm2
RESONANT CASE: Comparison ofModulation Pulse Slope
EFFECT OF POROUS SEDIMENT: Damping and High Frequency Smoothing
As shown by Nosov (for instance: Nosov and Kolesov [2007]), within the frame of a compressible model the energy transmitted to the water layer by the bottom motion is given by: Where S is the source area; substituting S with a (the source lengthin the 2-D model), we can rewrite The mean slope is effectively an indicator of the energy released by the bottom motion into the water layer and it scales proportionally to the source length and to the bottom velocity.
3. CONCLUSIONS The sea bottom motion always generates acoustic waves in the water layer. Only residual seafloor displacement definitely generates tsunami, while elastic seafloor motion may generate a tsunami depending on the motion frequency and on the water-column height (Nosov [1999]; Nosov and Kolesov [2007]). Nevertheless, the information about the extension, the velocity and the amplitude of the ground motion at the source can be recovered from the modulation. In turn this information allows us to infer whether a seafloor rupture has been probably produced or not with a residual displacement. In this sense, the acoustic modulation can be considered as a tsunami precursor.
The existence of acoustic waves generated by seafloor motion in the actual oceanic environment is demonstrated by the in-situ measurements performed by the real-time JAMSTEC observatory during the Tokachi-Oki-2003 earthquake and consequent tsunami. The spectral analysis of the water pressure records clearly shows the low-frequency elastic oscillation of the water column (Nosov et al. [2007]; Nosov and Kolesov [2007]) expected and predicted by the compressible fluid formulation
SUMMARIZING 1. The acoustic signal generated by the sea-floor motion travels from the source at sound speed, reaching the observation points much earlier than the possible tsunami wave. 2. The acoustic signal shows a low attenuation in amplitude also at a long distance from the source 3. The acoustic signal carries information on the source length, sea bottom rising velocity and water depth, also in the case of frequency interference 4. the main effect of the porosity is a low-pass filtering of the signals and a damping of the tsunami wave amplitude and the acoustic modulation