Download
1 / 26
260 likes | 424 Views
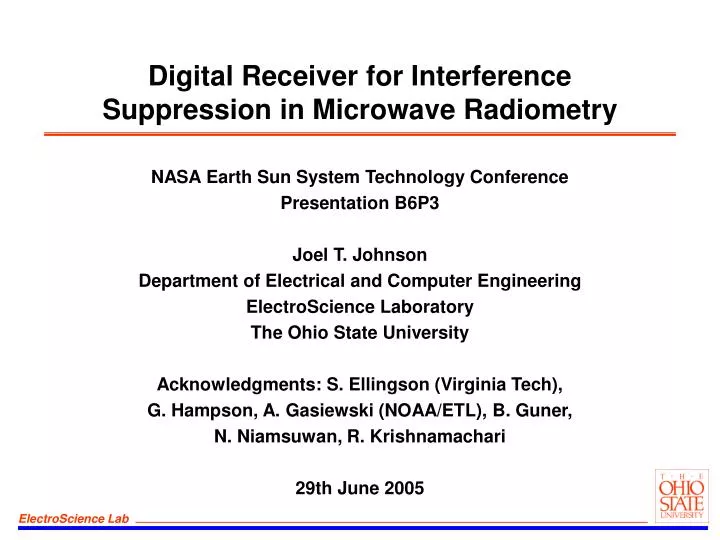
Digital Receiver for Interference Suppression in Microwave Radiometry. NASA Earth Sun System Technology Conference Presentation B6P3 Joel T. Johnson Department of Electrical and Computer Engineering ElectroScience Laboratory The Ohio State University

E N D
Digital Receiver for Interference Suppression in Microwave Radiometry NASA Earth Sun System Technology Conference Presentation B6P3 Joel T. Johnson Department of Electrical and Computer Engineering ElectroScience Laboratory The Ohio State University Acknowledgments: S. Ellingson (Virginia Tech), G. Hampson, A. Gasiewski (NOAA/ETL), B. Guner, N. Niamsuwan, R. Krishnamachari 29th June 2005
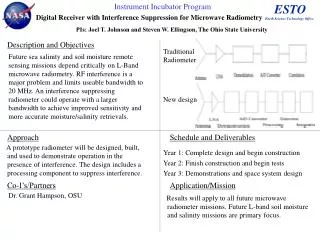
PIs: Joel T. Johnson (Ohio State) and Steven W. Ellingson (Virginia Tech) Digital Receiver With Interference Suppression for Microwave Radiometry Objectives 200 MSPS 10 bit ADC’s • Future sea salinity and soil moisture sensing missions use L-Band microwave radiometry • RF interference is a major problem and limits useable bandwidth to 20 MHz. • An interference suppressing radiometer could • reduce RFI effects on these systems • allow operation in a larger bandwidth for more accurate moisture/salinity retrievals • Project developed a radiometer digital backend including real-time removal of time and/or frequency localized RFI sources Implemented in Altera FPGA’s Real-time “pulse blanking” algorithm 1K FFT = high spectral resolution RFI removal Spectral processing/ integration 1K FFT Digital filtering/ pulse blanking Accomplishments • Receiver prototypes developed; sample 100 MHz bandwidth with real-time pulse blanking and 1K FFT • Demonstrated at Arecibo radio observatory and in local observations of water pool and sky targets • Results qualitatively show significant RFI mitigation and advantages of high spectral resolution • RFI surveys at L-band (including airborne measurements) completed under project support • System developed can be applied in other RF bands: NPOESS sponsored project using this system at C-band in progress: results to influence CMIS design • Proposal to utilize these technologies at L-band in the HYDROS program under evaluation TRLin =3;TRLout=4 http://esl.eng.ohio-state.edu/~rstheory/iip/docserv.html Project URL:
Outline • Introduction and system overview • Arecibo and local sky observations • Airborne observations at C-band • Space deployment issues
RFI Issues for Microwave Radiometers • A microwave radiometer is a sensitive receiver measuring naturally emitted thermal noise power within a specified bandwidth • Human transmission in many bands is prohibited by international agreement; these are the “quiet bands” ideal for radiometry • L-band channel quiet band is 1400-1427 MHz: larger bandwidth would improve sensitivity if RFI can be addressed. Ocean salinity missions require extremely high sensitivity. No protected bands at C-band. • Even within quiet band, RFI has still been observed - possibly due to filter limitations or intermodulation products • Many interferers are localized either in time or frequency: should be relatively easy to detect and remove with an appropriate system
Pulsed interferer (~msec) Time Radiometer integration period (~msec) System Overview • Properties of traditional radiometer: • very “slow” instrument • power integrated for msec before being digitized • a single, large bandwidth channel • susceptible to narrow band interference • Our design uses a digital receiver for rapid sampling • can mitigate temporally localized RFI • Our design performs a 1024 point FFT operation • can mitigate spectrally localized RFI • Processor operates in real time to reduce final data rate • implemented in hardware (FPGA’s) • L-Band Interference Suppressing Radiometer (LISR)
System Block Diagram Low-noise front end Analog Downconverter Digital Filtering Antenna ADC Asynchronous Pulse Blanker (APB) 1024 point FFT Frequency domain blanker Integration or Max Hold Data Recording/ Control
NBLANK NWAIT Threshold NSEP APB algorithm • APB updates mean/variance of incoming time domain signal; a sample > b standard deviations above the mean triggers blanker • Parameters are threshold (b), blanking window size (NBLANK), pre-trigger blanking region (NWAIT), and minimum delay between blanking events (NSEP) • Data zeroed when blanked; effect of this on calibration corrected later
ADC Analog Devices 9410 DIF APB FFT SDP ADC 100 MSPS I/Q 200 MSPS Digital Back-End • System design includes digital IF filtering (DIF), asynchronous pulse blanker (APB), FFT stage, and spectral domain processor (SDP) • LISR2: Altera "Stratix" FPGA’s: apprx 10000 LE, $260. LISR3: one Stratix FPGA: apprx 30000 LE, $950 • Microcontroller interface via ethernet for setting on-chip parameters • Possible modes: • Direct capture of time domain data, sampled every 10 nsec • Integration, blanker on/off, integration lengths 0.01 to 21 msec • Max-hold, blanker on/off
ADC DIF/ APB FFT SDP Capture ADC LISR Implementation • Modular form used for processor boards: note microcontrollers • EEPROM's on each card for autoprogramming of FPGA's on power-up
Outline • Introduction and system overview • Arecibo and local sky observations • Airborne observations at C-band • Space deployment issues
LISR early result: Blanking a Dual Frequency Radar at Arecibo The radio telescope at Arecibo, PR suffers from RFI from distant ground-based air search radars; LISR co-observed on 11/3/02 1325-1375 MHz spectra including digital IF, APB, FFT, and integration (42 msec) Before: ATC radar pulses visible After: APB removes radar
Antenna/Front End Unit for Local Sky Obs • Front end Tsys approx. 200K neglecting antenna Observing in band1325-1425 MHz; local ATC radar at 1331 MHz Mounted on 3 m dish outside laboratory Observation of astronomical sources and their variation with time
Sky Observation Verification • Software FFT’s allow very high spectral resolution (~4 kHz); sufficient to observe Doppler shift of neutral Hydrogen line Hydrogen line emission around 1420 MHz; “S-curve” is due to Doppler shift associated with galactic region observed Elapsed Time (Hr) Moon
LISR3 Sky Observations Using IIP Front End: Early results APB Off APB On +.25 dB -.25 dB Radar contributions greatly decreased by APB
Outline • Introduction and system overview • Arecibo and local sky observations • Airborne observations at C-band • Space deployment issues
Airborne Observations at C-band: CISR • NPOESS IPO sponsored project joint with NOAA/ETL using Polar Scanning Radiometer (PSR) system • PSR provides antenna, front end, and tuned downconverter for CISR digital backend (based on LISR implementation) • System provides tuned observation from 5.5-7.7 GHz at C-band; possible to calibrate using PSR calibration scheme • First deployment in SMEX04 campaign (August 04), followed by the AASI04 campaign (Oct-Nov 04) • Results are relevant for design of the CMIS C-Band channel; multiple analog sub-bands have been proposed as a mitigation scheme
CISR Example: AASI04 Test Flight • The largest CISR dataset is from a test flight on October 8th, 2004 in preparation for the AASI04 campaign • Note PSR includes 4 analog C-band channels for RFI mitigation (5.8-6.2, 6.3-6.7, 6.75-7.1, 7.15-7.5 GHz) • Comparison of PSR/ CISR data enables test of digital vs. analog methods • Use NOAA/ETL algorithm for RFI removal in 4 sub-band data Circles in Figure mark WFF and NDBC Buoy
PSR Images: AASI04 Test Flight over Buoy Time Time
Corresponding CISR Data (to 6.1 GHz) Provides precise knowledge of RFI center frequency Allows possibility of frequency domain blanking to remove RFI Calibrations show frequency domain blanking effective against narrowband RFI
CISR Advantages over PSR Calibrated CISR data for the point marked with green line shows narrowband RFI in PSR channel 4; calibration shows contribution ~4-5K to PSR PSR 4 x400 MHz channels show strong RFI; 4 channel algorithm chooses channel 4 (least corrupted) as correct
Use of APB at C-band • APB on/off data was recorded by CISR throughout C-band • Results >5.8 GHz show no influence of blanker • Results < 5.8 GHz show strong influence of blanker • As expected from freq. allocations in US Maximum raw data observed 5.7-5.8 GHz
Outline • Introduction and system overview • Arecibo and local sky observations • Airborne observations at C-band • Space deployment issues
Space Deployment • Three clear issues: (i) availability of space-qualified hardware, (ii) algorithm/environment issues, (iii) architecture/datarate issues • (i) The first is easy: rad-tolerant FPGA’s and ADC’s of similar size and performance already available • redundant programming further reduces failure rate • (ii) Algorithm issues: pulse-blanking and channelization appropriate only for time/frequency localized RFI; other types not removed • Need detailed information on RFI environment to design appropriate algorithms • Airborne RFI surveys performed as part of the project • L-band Interference Surveyor/Analyzer (LISA)
LISA: L-Band Interference Surveyor/Analyzer S.W. Ellingson, J.T. Johnson, and G.A. Hampson, The Ohio State University Nadir-looking cavity-backed spiral antenna w/ custom LNA & calibration electronics in tail radome NASA’s P-3 Orion Research Aircraft Maiden LISA Flight: January 2, 2003 from Wallops Island, VA RF distribution, antenna unit control & coherent sampling subsystem Spectrum analyzer, electronics rack & control console mounted in cabin Examples of RFI observed at 20,000 feet LISA co-observes with existing passive microwave sensors to identify sources of damaging radio frequency interference (RFI) • 1200-1700 MHz using broadbeam spiral antenna • Spectrum analyzer for full-bandwidth monitoring of power spectral density • 14 MHz (8+8 bit @ 20 MSPS) coherent sampling capability for waveform capture and analysis • Flexible script command language for system control & experiment automation
Space Deployment (cont’d) • (iii) Even for time/frequency blanking only, there are architecture/datarate issues that need to be explored: • On/off board frequency blanking • Off board more flexible, but must downlink all channels • On board allows a larger number of channels • FFT versus channelization filters: choice in terms of hardware size depends on number of sub-channels desired • Number of channels needed: depends on knowledge of RFI environment • Gains from oversampling input bandwidth: in case RFI enters from filter stop-band
Conclusions • Our work has provided the first demonstration of the use of digital receivers for radiometer backends to provide RFI suppression • Results qualitatively show the success of the algorithms implemented • C-band results show that a digital receiver backend can achieve improved RFI removal compared to an analog sub-band approach • Deployment in space highly likely in the future due to increasing RFI environment and desires for higher radiometric accuracy • Work currently continuing as part of a new IIP project led by Univ. of Michigan • Exploring proposal for Hydros instrument under this project