Download
1 / 43
470 likes | 865 Views
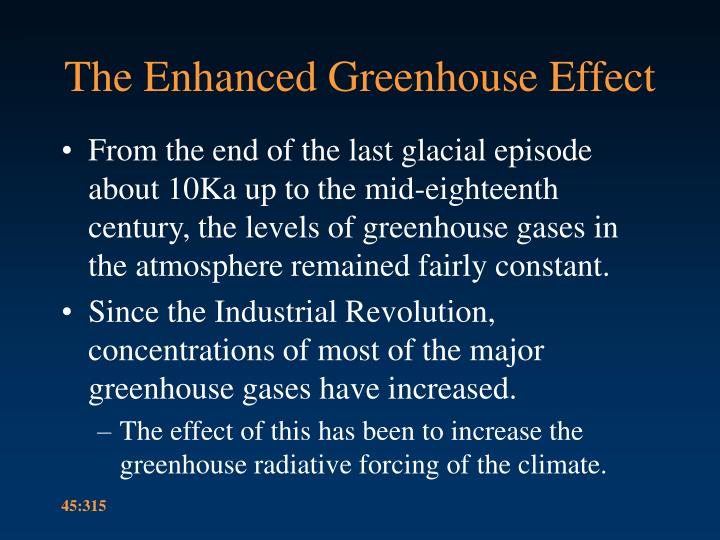
The Enhanced Greenhouse Effect. From the end of the last glacial episode about 10Ka up to the mid-eighteenth century, the levels of greenhouse gases in the atmosphere remained fairly constant. Since the Industrial Revolution, concentrations of most of the major greenhouse gases have increased.

E N D
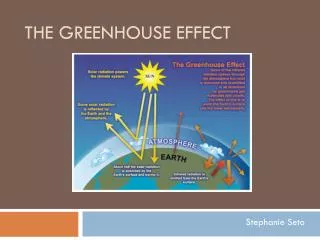
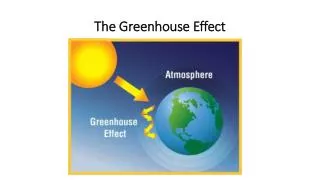
The Enhanced Greenhouse Effect • From the end of the last glacial episode about 10Ka up to the mid-eighteenth century, the levels of greenhouse gases in the atmosphere remained fairly constant. • Since the Industrial Revolution, concentrations of most of the major greenhouse gases have increased. • The effect of this has been to increase the greenhouse radiative forcing of the climate.
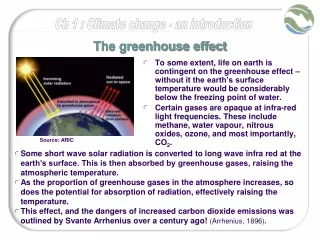
The Enhanced Greenhouse Effect • With more greenhouse gases in the atmosphere, more outgoing terrestrial radiation is trapped in the lower atmosphere, leading, presumably, to increases in surface temperature. • The debate as to whether this pollution of the atmosphere has increased global surface temperatures is ongoing.
Greenhouse Feedbacks • Global Climate Models have estimated the CO2 doubling temperature change to be approximately 1.2°C in the absence of feedback processes. • The existence of feedback loops within the climate system results in a climate sensitivity of 1.5°C to 4.5°C, and makes an otherwise linear association between radiative forcing and global temperature distinctly non-linear.
Feedback Ratio • The effect of feedback can be characterised in terms of the ratio of the temperature change with feedback to that without: Rf = DT/DTo = Gf/Go = 1/(1-f) • When the net feedback is positive, (1-f) < 1 and Rf > 1 (i.e. the response of the system is amplified/increased). • When the net feedback is negative, (1-f) is > 1 and Rf < 1 ( i.e. the response of the system is damped/reduced).
Climate Feedbacks • Three of the most important direct climatic feedbacks to greenhouse forcing are: • water vapour feedback, • cloud cover feedback and the • ice-albedo feedback.
Water Vapour Feedback • The concentration of water vapour in the atmosphere increases rapidly with rising temperature (about 6%/°C). • This is the basis for the strong positive water vapour feedback in current climate models • increases in temperature produce increases in atmospheric water vapour which in turn enhance the greenhouse forcing leading to further warming).
Ice-Albedo Feedback • A warmer Earth will have less snow and ice cover, resulting in a lower global albedo and consequent absorption of more solar radiation. This, in turn causes a further warming of the climate. • Most GCMs have simulated this positive surface albedo feedback, but • significant uncertainties exist over the size of the effect, particularly for sea-ice
Cloud Feedback • The effects of changes in cloud on a change of climate have been identified as a major source of uncertainty in climate models • clouds contribute to the greenhouse warming of the climate system by absorbing more outgoing infrared radiation (positive feedback), • they also produce a cooling through the reflection and reduction in absorption of solar radiation (negative feedback)
Net Cloud Feedback • The presence of cloud cover on Earth reduces the mean global surface temperature by about 7.5oC (compared to a cloud-free Earth). • Increases in cloud cover thus seem to constitute a net negative feedback to climate change (although the Table of feedback values is not definitive on this).
The Enhanced Greenhouse Effect • From the end of the last glacial episode about 10Ka up to the mid-eighteenth century, the levels of greenhouse gases in the atmosphere remained fairly constant. • Since the Industrial Revolution, concentrations of most of the major greenhouse gases have increased. • The effect of this has been to increase the greenhouse radiative forcing of the climate.
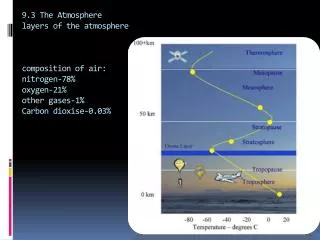
Trace Gases • Most of Earth’s atmosphere is climatically neutral • the really important gases are present in trace amounts only
Trends in GHGs • Since the mid-1800s, • atmospheric levels of carbon dioxide have increased 30 percent (from 280 parts per million to 360 parts per million), • the concentration of methane has more than doubled (to about 1.72 parts per million), and • nitrous oxide levels have increased by a more modest 10-15%.
Carbon Cycle • The earth's natural processes continually exchange massive quantities of carbon. • Oceans release about 90 billion tonnes of CO2 into the atmosphere each year. • Decaying vegetation adds another 30 billion tonnes annually, while • another 30 billion tonnes each year is released from the natural respiration of living creatures and plants.
Global Carbon Cycle Oak Ridge National Laboratory
Human Sources of CO2 • Human activities add an extra 3% to this natural cycle, or about 7 billion tonnes per year. The majority of human CO2 comes from the burning of fossil fuels. The residence time of CO2 in the atmosphere is ~100 to 200 years
Cumulative carbon emissions, 1950-1996 Data Source: Marland et al, 1999. Carbon Dioxide Information Analysis Center.
Carbon Sinks • At the same time, natural processes - primarily absorption by the oceans and by the photosynthesis process of green plants - remove the natural and much of the human CO2 from the atmosphere. • The net result of this "carbon cycle" is a net increase of about 3.1 to 3.5 billion tonnes of CO2 annually to the atmosphere.
Air is Mobile • While sources of contaminants may be fixed (or relatively so), air movements and circulation can carry contaminants far and wide: • distance depends on residence time and weather conditions; • we find industrial chemicals (such as PCBs) in the Arctic and Antarctic; • we find CO2 all over the globe
Atmospheric carbon dioxide (CO2):1750 to present Data Source: C.D. Keeling and T.P. Whorf, Atmospheric CO2 Concentrations (ppmv) derived from in situ air samples collected at Mauna Loa Observatory, Hawaii, Scripps Institute of Oceanography, August 1998. A. Neftel et al, Historical CO2 Record from the Siple Station Ice Core, Physics Institute, University of Bern, Switzerland, September 1994. See http://cdiac.esd.ornl.gov/trends/co2/contents.htm
Methane • Unlike carbon dioxide, methane is destroyed by reactions with other chemicals in the atmosphere. • Its approximate lifetime is about 10 years.
Methane Potential • On the other hand, on a molecule-for-molecule basis, methane is a much greater absorber of energy than carbon dioxide. • As a greenhouse gas, a methane molecule is more than 20-times more potent than than a carbon dioxide molecule.
Nitrous Oxide • As a greenhouse gas, its major source is the bacterial breakdown of nitrogen compounds in soils. • When land is deforested and then cultivated, nitrous oxide emissions can increase, particularly if nitrogen-containing fertilizers are used.
Nitrous Oxide Potential • Nitrous oxide is even more potent than methane as a greenhouse gas. • A nitrous oxide molecule may be as much as 300 times more potent than a molecule of carbon dioxide.
Ozone • Ozone is a molecule made up of three oxygen atoms (normal atmospheric oxygen has two oxygen atoms bound in each molecule). • At high altitudes in the stratosphere, ozone forms a protective layer, shielding the Earth's inhabitants from potentially harmful ultraviolet radiation.
Low Level Ozone • At lower levels, however, ozone can form a relatively short-lived greenhouse gas. • The gases responsible for low-level ozone are carbon monoxide and nitrogen oxides (from vehicle emissions), methane and other HCs. • Ozone is not particularly stable in the lower atmosphere and breaks down in a few days or weeks. • Its transient nature makes it difficult to estimate its contribution to the greenhouse effect.
CFCs • Molecule for molecule, chlorofluorocarbons are the most potent of greenhouse gases. • CFC-12 or "Freon-12" as it is known by its trade name, is 17,700 times more potent than carbon dioxide. • Although they exist in only minute quantities in the atmosphere, CFCs are thought to be responsible for about 20% of the enhanced greenhouse effect.
Aerosols • A suspension of liquid or solid matter in air • These microscopic particles act as nuclei for water droplets to collect and form clouds. • Clouds reflect sunlight back into space, cooling the planet. • Sulphate aerosols are the most important category. They originate from sulphur dioxide (SO2) which is emitted largely from the burning of coal.
Sulphate Aerosols The climatic effects of sulphate aerosols is estimated to be comparable to the present forcing due to increased GHGs (but in the opposite direction) • Residence time is quite brief (months) but emission rates are quite high
Global Warming Potential • The concept of a Global Warming Potential (GWP) has been developed to compare the effect of each greenhouse gas in trapping heat in the atmosphere relative to another gas. • Carbon dioxide was chosen as the reference gas by the IPCC.
Global Warming Potential • The GWP of a greenhouse gas is the ratio of global warming, or radiative forcing – both direct and indirect – from one kg mass of a greenhouse gas to that of one kg mass of carbon dioxide over a period of time. • While any time period can be selected, the 100 year GWP recommended by the IPCC has generally been used. GWP values are listed in the following Table.
Global Warming Potential • GWP depends on: • radiative properties of the gases • atmospheric lifetime • existing concentration in the atmosphere
Ozone Hole • The ozone hole is a well-defined, large-scale destruction of the ozone layer over Antarctica that occurs each spring. • The word "hole" is a misnomer; it is really a significant thinning, or reduction in ozone concentrations, which results in the destruction of up to 70% of the ozone normally found over Antarctica.
In the stratosphere, UV radiation breaks down CFC molecules, releasing atomic chlorine. A free chlorine atom reacts with an ozone molecule, converting it from O3 to O2. Cl + O3 = ClO + O2 Unstable Cl + O Cl + O3 = ClO + O2