Download
1 / 38
390 likes | 520 Views
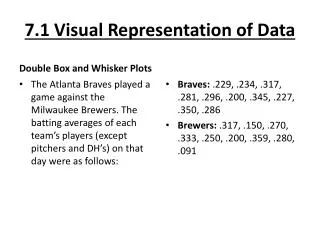
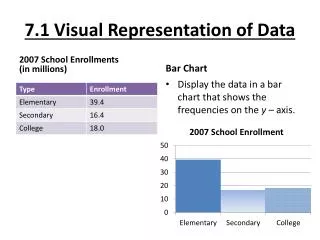
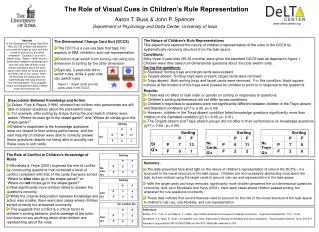
The Representation of Visual Salience in the Superior Colliculus. Brian White 1 , Takuro Ikeda 1 , David Berg 2 , Laurent Itti 2 , Doug Munoz 1 1 Centre for Neuroscience Studies, Queen’s , Kingston , ON, Canada 2 University of Southern California, Los Angeles, CA, USA

E N D
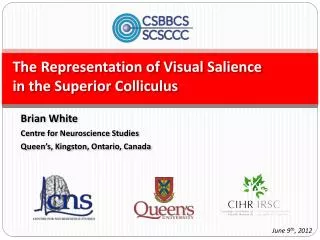
The Representation of Visual Salience in the Superior Colliculus Brian White1, Takuro Ikeda1, David Berg2, Laurent Itti2, Doug Munoz1 1Centre for Neuroscience Studies, Queen’s, Kingston, ON, Canada 2University of Southern California, Los Angeles, CA, USA NanosymposiumSession 833.02
Frontal Parietal Thalamus SC: Primitive Saliency Encoder Occipital Visual Orienting System Retina SCi SCs SC = superior colliculus (optic tectum non-mammals) SCs = Superficial Layers SCi = Intermediate Layers Brainstem
Aim • Directly test whether the SC shows evidence of a visualsaliency map in primates • Used dense arrays of goal-irrelevant stimuli to mimic complex stimulation evoked by natural images
(i) Single item cond (ii) Popout cond (iii) Conjunction cond Response Field
(i) Single item cond (ii) Popout cond (iii) Conjunction cond
(i) Single item cond (ii) Popoutcond (iii) Conjunction cond
(i) Single item cond (ii) Popout cond (iii) Conjunctioncond
Saccade Abrupt onset
Saccade Abrupt onset single item in RF +
Saccade Abrupt onset single item in RF +
Saccade Abrupt onset single item Anti RF +
Saccade Abrupt onset popout stimulus in RF +
Saccade Abrupt onset popout stimulus Anti RF +
Saccade Abrupt onset conjunction condition + p<.05
Abrupt onset N=23 neurons
Abrupt onset 78% p<.05 22% N=23 neurons
Saccade Abrupt onset 78% 74% p<.05 p<.05 22% 26% N=23 neurons
Frontal Parietal Thalamus Occipital Retina SCi SCs Brainstem
Saccade Abrupt onset 150 SC Depth 100 100 SCs (0.3 - 1mm) N=14 Spks/s p<.05 p<.05 50 50 0 0 0 0 200 200 400 400 200 200 400 400 Time from stimulus (ms) Time from saccade end (ms) SCi (1 - 2.5mm) N=9 Spks/s Time from stimulus (ms) Time from saccade end (ms) Popout in RF Popout Anti RF Conjunction
Summary • SC neurons showed greater visual activation for popout relative to conjunction and anti-popoutconditions, even though the stimuli were goal-irrelevant • The difference emerged after initial visual transient. • A similar pattern observed previously in V4(Burrows & Moore, 2009), andLIP (Arcizet, Mirpour & Bisley 2011). • Observed primarily in the superficial visual-only layers • where the predominant inputs arise from visual cortex, not parietal/frontal cortices.
Visual Orienting System Frontal Parietal Thalamus Occipital SCi SCs SCs = Superficial Layers SCi = Intermediate Layers Brainstem
Visual Orienting System Frontal Parietal Thalamus Feature maps Occipital Luminance, Color, Orientation, Motion SCi SCs SCs = Superficial Layers SCi = Intermediate Layers Brainstem
Visual Orienting System Frontal Parietal Thalamus Feature maps Occipital Luminance, Color, Orientation, Motion Saliency map SCs SCi SCs = Superficial Layers SCi = Intermediate Layers Brainstem
Visual Orienting System Frontal Parietal Thalamus Feature maps Occipital Luminance, Color, Orientation, Motion Saliency map SCs SCi SCs = Superficial Layers SCi = Intermediate Layers Brainstem
Munoz Lab: Doug Munoz, Takuro Ikeda Josh Wang, Robert Marino, Susan Boehnke Centre for Neuroscience Studies, Queen’s Kingston, ON, Canada ILab: Laurent Itti, David Berg University of Southern California Technical: Ann Lablans, Lindsey Duck, Donald Brien, Sean Hickman, Mike Lewis. Funding:CIHR, DARPA
Local field potentials (LFP) Single item in RF Single item anti-loc Popout item in RF Popout item anti-loc Conjunction SCs SCi
Pursuit Response Field
Single item in RF SCs (N=19) 100 50 Spks/s -500 0 500 Time pursuit crossed center (ms)
Single item in RF SCs (N=19) 100 50 Spks/s -500 0 500 Time pursuit crossed center (ms)
Single item Anti RF SCs (N=19) 100 50 Spks/s -500 0 500 Time pursuit crossed center (ms)
Popout in RF SCs (N=19) 100 50 Spks/s -500 0 500 Time pursuit crossed center (ms)
Popout Anti RF SCs (N=19) 100 50 Spks/s -500 0 500 Time pursuit crossed center (ms)
Conjunction condition SCs (N=19) p<.01 100 100 50 50 Spks/s Spks/s SCi (N=14) 500 -500 0 -500 0 500 Time pursuit crossed center (ms) Time pursuit crossed center (ms)
Comparison of timing of “popout” and VROL between SC, V4, LIP • SCs: • Popout~85ms (abrupt onset) ~60ms (saccade) • VROL ~50ms • V4 (Burrows & Moore, 2009) • Popout105ms • VROL ~64ms • LIP (Arcizet, Mirpour & Bisley 2011) • Popout75ms • VROL ~40ms
Comparison between SCs vs V1 200 200 B V1 neuron A SCs neuron 150 150 C 1 SCs (n=18) Activation (spks/s) Activation (spks/s) 100 100 SCi (n=17) V1 (n=10) Cumulative proportion neurons VROL 55ms VROL 57ms 50 50 0.5 0 400 200 400 600 600 200 0 Time from stimulus onset (ms) Time from stimulus onset (ms) 0 40 60 80 100 120 VROL (ms) V2 V4 V1 V3 MT MST FEF M-LGN P-LGN D 1 Cumulative proportion neurons 0.5 adapted from Schmolesky et al. (1998) for comparison 0 40 60 80 100 120 VROL (ms)
Neural Representation during Free-Viewing HD clips Saliency Model Visual space SC Space
Correlation between model and SC neuron 100 Model SC neuron 80 Activation (spks/s) 60 40 20 1800 1600 1400 2000 2200 2400 Time from clip onset (ms) 8 median = 0.18 p < .00001 (sign-test) 6 # Neurons 4 2 -0.5 0.5 0.0 Correlation Coefficient