Download
1 / 20
200 likes | 214 Views
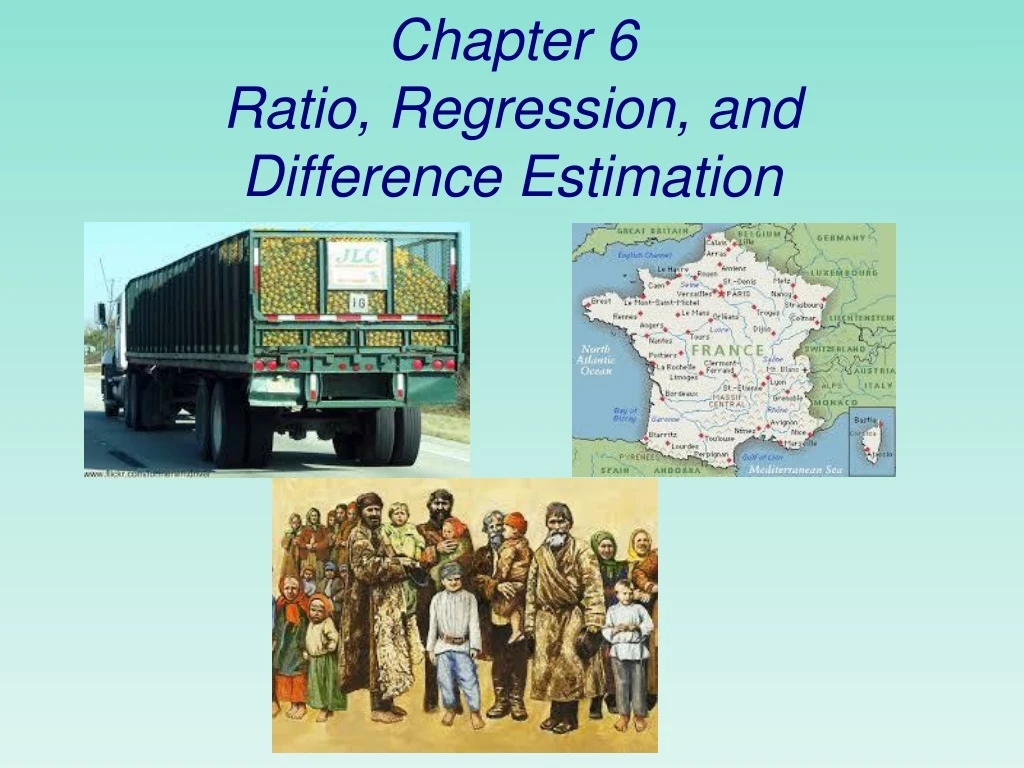
Chapter 6 Ratio, Regression, and D ifference Estimation. How many?. Ratio Estimation. In 1802, Laplace wanted to estimate the population of France. He sampled 30 communes throughout the country. There were 2,037,615 people living in those communes.

E N D
How many? Ratio Estimation • In 1802, Laplace wanted to estimate the population of France. • He sampled 30 communes throughout the country. • There were 2,037,615 people living in those communes. • Between 1799 and 1802 (3 years), 215,599 births were registered to those communes. • Laplace calculated that there was one birth for every 28.35 people. If you were given the number of births in France between 1799 and 1802, could you estimate the population?
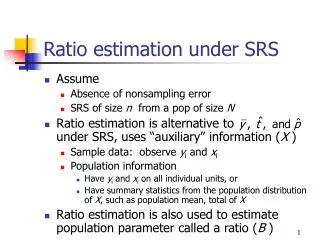
Ratio Estimation in an SRS • Calculating the age of a tree (or the volume of wood in a tree) is hard, time-consuming work. However, • tree age correlates with tree diameter, which is easy to measure. • volume correlates with diameter and height • yi=the age of the tree; xi=the diameter of the tree
Ratio Estimation in an SRS Using auxiliary information • Auxiliary information about the population may include a known variable to which the variable of interest is related (correlated). • The auxiliary information typically is easy to measure, whereas the variable of interest may be expensive to measure. Measure 2 quantities on each sample unit • y variable of interest • x auxiliary variable
Example: Ratio Estimation in SRS • Wholesale price of oranges in large shipments based on sugar content of entire load • Sugar content cannot be determined before extraction of juice from the entire load. How much orange juice can be made from these oranges?
Method 1 Example, p. 2 Method 2 Fact: the sugar content y of an individual orange is closely related to its weight x. No need for N
Ratio Estimationin an SRS How many jelly beans in this jar?
Ratio Estimation in an SRS • Correlation is important! • Ratio and regression information take advantage of the correlation of x and y in the population. • The higher the correlation, the better ratio and regression estimators work.
Example: (Food additive) • A researcher was investigating a new food additive for cattle. Midway through the two-month study, she was interested in estimating the ratio of present weight to pre-study weight for the entire herd of N = 500 steers. A simple random sample of n = 12 steers was selected from the herd and weighed. These data and pre-study weights are presented in the accompanying table for all cattle sampled. Assume the pre-study total = 440,000 pounds. • Estimate the ratio of present weight to pre-study weight of the herd, and provide an estimate of the standard error for your answer.
The estimate of the ratio R of the present weight to pre-study weight for the herd is: Solution: On average, a steer is about 7.4% to 19.4% heavier