Download
1 / 22
260 likes | 430 Views
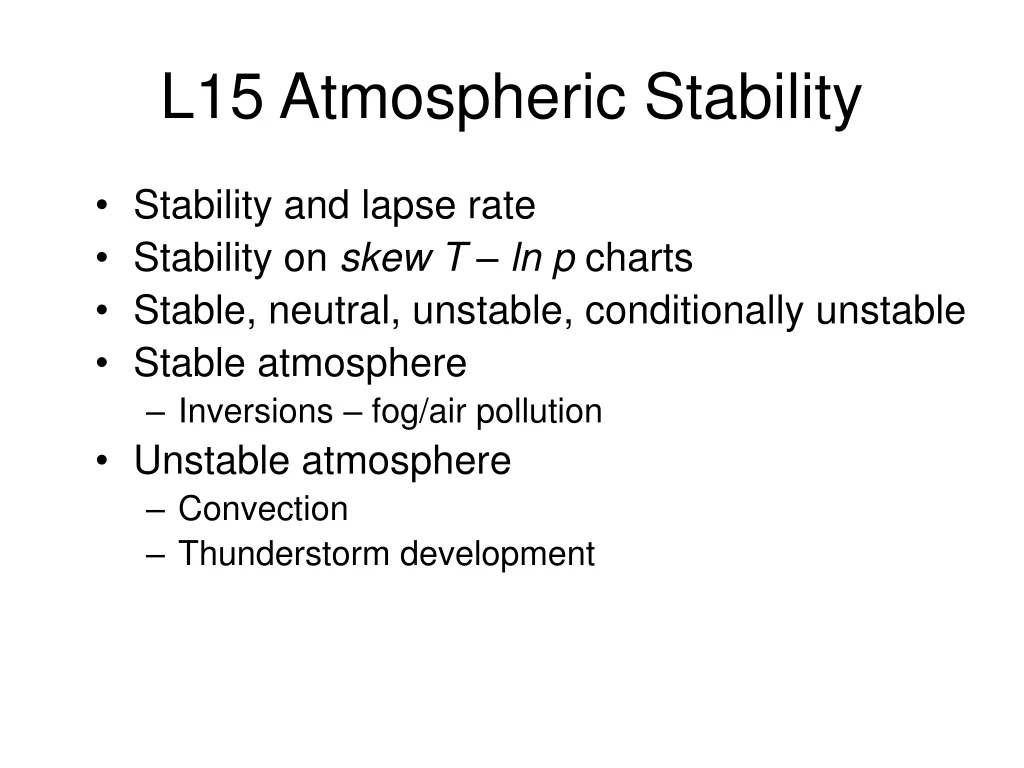
L15 Atmospheric Stability. Stability and lapse rate Stability on skew T – ln p charts Stable, neutral, unstable, conditionally unstable Stable atmosphere Inversions – fog/air pollution Unstable atmosphere Convection Thunderstorm development. Static stability of dry air.

E N D
L15 Atmospheric Stability • Stability and lapse rate • Stability on skew T – ln p charts • Stable, neutral, unstable, conditionally unstable • Stable atmosphere • Inversions – fog/air pollution • Unstable atmosphere • Convection • Thunderstorm development
Static stability of dry air 1st case: Real lapse rate, Γis less than the DALR, Γd What happens to air at ‘O’ that is displaced upwards by a disturbance? And what happens if it isdisplaced downwards? See Wallace & Hobbs section 3.6
Static stability of dry air 2nd case: Real lapse rate, Γ> Γd What happens to air at ‘O’ that is displaced upwards by a disturbance? And what happens if it isdisplaced downwards? See Wallace & Hobbs section 3.6
Useful analogy for stability:ball on a surface Stable Unstable Neutral Conditionalinstability Unstable profilescannot persist, sotend to rapidlyevolve to be ~neutral
Stability and air pollution Match the plume dispersionpattern to the temperatureprofiles below Atmospheric temperature profileis the solid line.Dry adiabat is dashed line.
Stability and air pollution Neutral profile – smokegoes anywhere Stable profile – smokestays at emitted height Stable above, neutralbelow – smoke mixes down but not up Neutral above, stablebelow – smoke mixes up but not down Atmospheric temperature profileis the solid line.Dry adiabat is dashed line.
Conditionally unstable Stable Absolutely unstable • Stability on skew T-ln p diagram stable
Absolutely unstable example Tiny unstable layer near ground
Extreme example of instability: a forest fire Any form of strong heating of the ground can cause instability
Inversion layer example Very stable layerprobably definingthe top of the boundary layer. Very stable layerswhere temperatureincreases with heightare called ‘inversions’. Top of the BL oftencapped by aninversion – tends totrap pollution in BL
Edinburgh, c 1950 ‘auld reekie’ London, 1952
Nottingham Skew T-log P on day of Buncefield Fire (12Z, 11 Dec 2005) Strong inversionnear ground
South Pole:Note it is cold!!Surface pressure isonly ~700 hPaVery stable thinlayer close to surface • Scott-Amundsen South Pole station
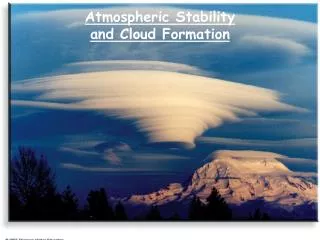
Small scale cumulusclouds – typical ofconvection and anunstable tropicalatmosphere.In the tropics theseclouds typically build up during the day to cumulonimbusas surface heatingincreases theinstability. • Douala, Cameroon • (Image from Google earth)
Summary • Stability and lapse rate • Stability on skew T – ln p charts • Stable, neutral, unstable, conditionally unstable • Stable atmosphere • Inversions – fog/air pollution • Unstable atmosphere • Convection • Thunderstorm development – more next time