Download

1 / 17
170 likes | 173 Views
Learn about empirical analysis of patient flows through the emergency department in hospitals and the suitable architecture for efficient operations.

E N D
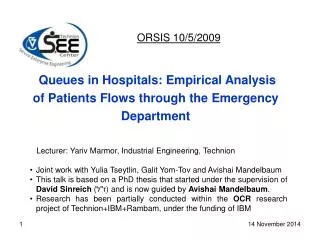
ORSIS 10/5/2009 Queues in Hospitals: Empirical Analysis of Patients Flows through the Emergency Department Lecturer: Yariv Marmor, Industrial Engineering, Technion • Joint work with Yulia Tseytlin, Galit Yom-Tov and Avishai Mandelbaum • This talk is based on a PhD thesis that started under the supervision of David Sinreich (ז"ל) and is now guided by Avishai Mandelbaum. • Research has been partially conducted within the OCR research project of Technion+IBM+Rambam, under the funding of IBM
Hospital Overview Services IW1 Yulia Emergency Department Patient discharge IW5 Arrivals MU1 Patient discharge Patients abandon MUn Galit Joint project with Mandelbaum A., Yom-Tov G., and Tseytlin Y. : Analyze ED, IW, and their interfaces, using simulation, empirical and theoretical models.
Addressing the Following Questions: • Given an ED environment, identify a suitable ED architecture (DEA / simulation / mathematics). • Explain the difference in IW-LOS distributions, when plotted in resolutions of days vs. hours (+implication). • Why is the distribution of ED lengths of stay (LOS) LogNormal? (no clear answer, yet) • How to measure offered-load (congestion) in EDs? How to use it in support of staffing decisions (on-line, off-line)?
Given an ED Environment, Identify a Suitable ED Architecture: Data
Given an ED Environment, Identify a Suitable ED Architecture: Arrivals rate to the ED*(from Non Homogeneous Poisson process) *Via SEEStat
Given an ED Environment, Identify a Suitable ED Architecture: Parameters • Outputs (Yjo): • Average length of stay. • Net patients throughput. • Number of patients waiting for a bed. • Controllable inputs (Xio): • Manpower (70% of total costs). • Number of beds in the ED. • Number of hospitalizations. • Uncontrollable inputs (Zko): • Number of children / elderly. • Number of patients with injury. • Number of patients arriving by ambulance. • Number of patients referred by physician
Given an ED Environment, Identify a Suitable ED Architecture: Mathematical Model (DEA) Efficiency
Given an ED Environment, Identify a Suitable ED Architecture: Comparison(DEA) => Best operating models: Fast Track (priority models) Triage (routing control) (Ongoing research)
Why is the Distribution of ED Lengths of Stay (LOS) LogNormal?
Why is the Distribution of ED Lengths of Stay (LOS) LogNormal: Phase Type Approximation Each phase is exponential Phase Type Total LOS is LogNormal
Explain the Difference in IW-LOS Distributions, When Plotted in Resolutions of Days vs. Hours 1 day resolution
Explain the Difference in IW-LOS Distributions, When Plotted in Resolutions of Days vs. Hours 2 hour resolution
Explain the Difference in IW-LOS Distributions, When Plotted in Resolutions of Days vs. Hours (implication): Arrival / Departure Rate
Exit Dr Arrivals X-Ray Nurse Lab How to Measure Offered-Load (Congestion) in the ED: Offered-Load Model in Mt/G/∞ ∞ ∞ i – index of node. => Find the nominal resource level needed
How to Measure Offered-Load (Congestion) in the ED: Staffing Rule a is the fraction of patients that start service within T time units (Quality of Service) (We have useda=0.1, andT=30minutes for the first patient-physician encounter) h(bt) is the Halfin-Whitt function (Halfin & Whitt 1981) Staffing rule (Halfin & Whitt 1981; Borst, Mandelbaum, & Reiman 2004) :
How to Measure Offered-Load (Congestion) in the ED: Results for On-Line Staffing Decisions Comparison of the predicted for each hour in the rest of the shift: • Current: The current staffing rule. • RCCP (Rough Cut Capacity Planning): Efficiency driven staffing rule. • OL: Offered-Load staffing rule.