Download
1 / 23
230 likes | 234 Views
Explore the latest data on US agricultural trade, including corn and soybean supply and use, meat production and prices, as well as the value of agricultural exports. Discover the growth of NAFTA agricultural trade with Canada and Mexico, and Iowa's top exports in agriculture and manufacturing.

E N D
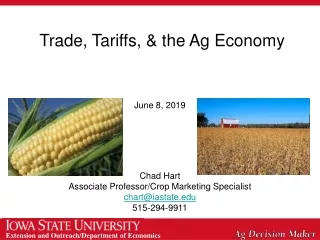
Ag Trade June 19, 2017 Chad Hart Associate Professor/Crop Marketing Specialist chart@iastate.edu 515-294-9911
U.S. Corn Supply and Use Source: USDA-WAOB
U.S. Soybean Supply and Use Source: USDA-WAOB
Soybean Export Sales Source: USDA-FAS
Change in Corn Export Sales Source: USDA-FAS
Change in Soybean Export Sales Source: USDA-FAS
U.S. Meat Production & Prices Source: USDA-WAOB
U.S. Meat Trade Million pounds Source: USDA-WAOB
U.S. Pork Exports, Jan-Mar 2017 (Carcass Wt Basis) WASDE U.S.: 2015: 5,009 mil lbs 2016: 5,233 (+4%) 2017: 5,670 (+8%) Source: USDA/ERS
U.S. Beef Exports, Jan-Mar 2017 (Carcass Weight Basis) WASDE U.S.: 2015: 2,265 mil lbs 2016: 2.550 (+13%) 2017: 2,725 (+7%) Source: USDA/ERS
U.S. Beef Imports, Jan-Mar 2017 (Carcass Weight Basis) WASDE U.S.: 2015: 3,371 mil lbs 2016: 3,016 (-11%) 2017: 2,745 (-9%) Source: USDA/ERS
Value of Ag Trade Source: USDA-FAS
U.S. Ag Exports Source: USDA-FAS
NAFTA Agricultural Trade with Canada Two-way trade up 393% since NAFTA Source: US Census Bureau, Foreign Trade Statistics, FATUS export aggregations
NAFTA Agricultural Trade with Mexico Two-way trade up 517% since NAFTA Source: US Census Bureau, Foreign Trade Statistics, FATUS export aggregations
Iowa’s state export rankings, 2015 # 2 Soybeans $2.516 billion # 1 Pork $1.988 billion # 1 Feeds $1.506 billion # 1 Corn $1.398 billion # 2 Soybean meal $639 million # 2 Vegetable oils $392 million # 4 Beef $356 million # 2 Hides $293 million # 12 Dairy $122 million Source: USDA Economic Research Service, “State Export Data”
Iowa’s top 10 manufactured exports, 2015 1. Tractors $764 million 2. Herbicides 405 million 3. Aircraft engines/parts 264 million 4. Harvesting machinery 259 million 5. Aluminum alloy plates 250 million 6. Front-end loaders 179 million 7. Special purpose vehicles 152 million 8. Excavators 119 million 9. Ag/Hort/Forestry mach. 116 million 10. Medical instruments 105 million Source: http://www.census.gov/foreign-trade/statistics/state/data/ia.html
World Corn Markets Source: USDA
Thank you for your time!Any questions?My web site:http://www2.econ.iastate.edu/faculty/hart/Iowa Farm Outlook:http://www2.econ.iastate.edu/ifo/Ag Decision Maker:http://www.extension.iastate.edu/agdm/