1 / 31

Figure 8.1 Various types of manufacturing costs incurred by a manufacturer.

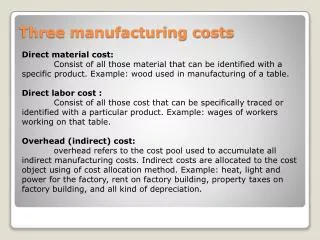
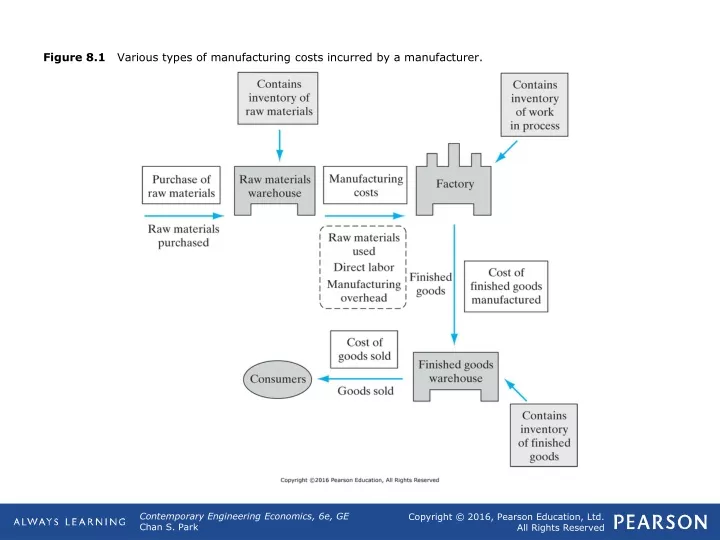
Figure 8.1 Various types of manufacturing costs incurred by a manufacturer. Figure 8.2 How the period costs and product costs flow through financial statements from the manufacturing floor to sales. Figure 8.3 Cost flows and classifications in a manufacturing company.

ldonaldson
Download Presentation

Figure 8.1 Various types of manufacturing costs incurred by a manufacturer.

An Image/Link below is provided (as is) to download presentation Download Policy: Content on the Website is provided to you AS IS for your information and personal use and may not be sold / licensed / shared on other websites without getting consent from its author. Content is provided to you AS IS for your information and personal use only. Download presentation by click this link. While downloading, if for some reason you are not able to download a presentation, the publisher may have deleted the file from their server. During download, if you can't get a presentation, the file might be deleted by the publisher.

E N D

Presentation Transcript


  1. Figure 8.1 Various types of manufacturing costs incurred by a manufacturer.

  2. Figure 8.2 How the period costs and product costs flow through financial statements from the manufacturing floor to sales.

  3. Figure 8.3 Cost flows and classifications in a manufacturing company.

  4. Table 8.1 Breakdowns of Unit Cost Items

  5. Table 8.2 Cost Classifications of Owning and Operating a 4WD Sport-Utility Vehicle

  6. Table 8.3 Operating Costs as a Function of Mileage Driven

  7. Figure 8.4 Cost–volume relationships pertaining to annual automobile costs (Example 8.2).

  8. Figure 8.5 Average cost per mile of owning and operating a car (Example 8.2).

  9. Figure 8.6 Cost–Volume–Profit Curve––A profit maximization (unit: 1,000).

  10. Figure 8.7 Linear approximations of total revenue and total cost curves.

  11. Table 8.4 Differential Cost of Going with Better Dies

  12. Figure 8.8 Cost-volume relationships of operating overtime, and a Saturday operation versus second-shift operation beyond 24,000 units (Example 8.5).

  13. Table 8.5 Breakdowns of Cost Items

  14. Figure 8.9 Marginal versus average cost per kWh (Example 8.7).

  15. Figure 8.10 Weekly profits as a function of time. Sunday operation becomes unprofitable, because the marginal revenue stays at $10 per case, whereas the marginal cost increases to $12 per case (Example 8.8).

  16. Table 8.6 Net Profit Calculation as a Function of Production Volume (Example 8.8)

  17. Figure 8.11 Process of creating a master production budget.

  18. Table 8.7 Sales Budget Schedule (Year 2016)—Product X

  19. Table 8.8 Production Budget (Year 2016)—Product X

  20. Table 8.9 Direct Materials Budget (Year 2016)—Product X

  21. Table 8.10 Direct Labor Budget (Year 2016)—Product X

  22. Table 8.11 Manufacturing Overhead Budget (Year 2016)—Product X

  23. Table 8.12 Cost of Goods Sold (Year 2016)—Product X

  24. Table 8.13 Selling Expenses (Year 2016)—Product X

  25. Table 8.14 Administrative Expenses (Year 2016)—Product X

  26. Table 8.15 Budgeted Income Statement (Year 2016)—Product X

  27. Table P8.4

  28. Figure P8.6

  29. Figure P8.8

  30. Figure P8.9

  31. Table ST8.3

More Related