Download
1 / 17
280 likes | 693 Views
The Collision Theory and Activation Energy. Explaining how and why factors affect reaction rates. The Maxwell-Boltzmann apparatus. Maxwell and Boltzmann performed an experiment to determine the kinetic energy distribution of atoms

E N D
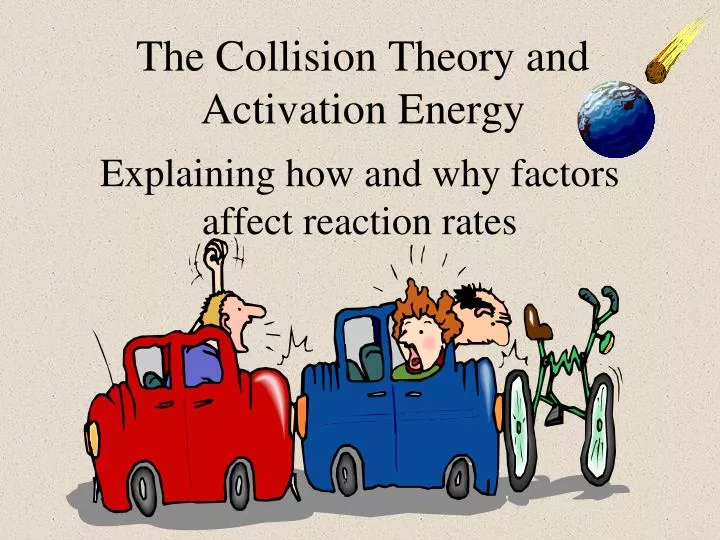
The Collision Theory and Activation Energy Explaining how and why factors affect reaction rates
The Maxwell-Boltzmann apparatus • Maxwell and Boltzmann performed an experiment to determine the kinetic energy distribution of atoms • Because all atoms of an element have roughly the same mass, the kinetic energy of identical atoms is determined by velocity (KE= ½mv2)
Fraction of molecules Kinetic energy The Maxwell-Boltzmann distribution Basically, if we plot the intensity of the dots on a graph we get a graph of fraction of atoms/molecules vs. kinetic energy: • The resulting disk looks like this: Molecules hit disk first Molecules hit disk last
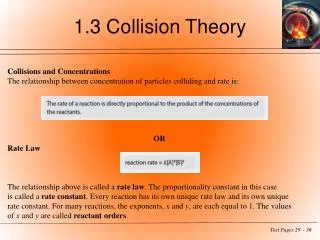
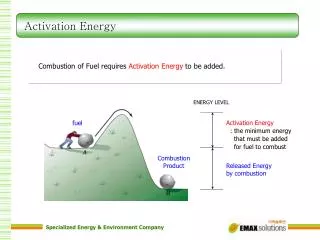
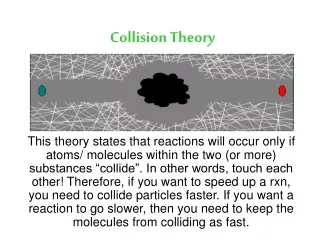
COLLISION THEORY • Rate proportional to fraction of effective collisions x collision frequency • Effective collisions with enough KE = ACTIVATION ENERGY
Factors that affect number of effective collisionsrelated to activation energy chemical nature of reactants Temperature (faster moving molecules means more collisions per unit of time). Catalyst
Factors that affect collision frequency • Related to number of collisions • Concentration • Surface area • temperature
Fraction of molecules Ea Kinetic energy Temperature and reaction rate • By increasing the temperature, a small number of molecules reach Ea. The reaction is exothermic, further increasing temperature and causing more molecules to reach Ea, etc. Shift due to higher temperature
Ea Potential Energy (Ep) Fraction of molecules Path of reaction Kinetic energy kinetic vs. potential energy diagrams • Recall the Maxwell-Boltzman distribution (i.e. kinetic energy diagram) • The Ea is a critical point. To examine it more closely we can use a potential energy graph • The axes are not the same, thus the Ep graph is not a blow up of the Ek graph; however it does correspond to the part of the Ek graph that is circled
Activated complex / transition state Ea Ep (Potential energy stored in chemical bonds) H Collision begins Collision ends Path of reaction potential energy graph: a closer look Reactants Products A2 & B2 rush together molecules slow down Ep , Ek molecules speed up Ep , Ek 2AB molecules float apart Ep + Ek =constant throughout Overall Ep(reactants)>Ep(products) Ek(reactants)<Ek(products)
Ea forward Ep Ea reverse H is positive Ep graph: Important points Exothermic Endothermic • Forward and reverse reactions are possible • Ea is the difference between Ep at transition state and initial or final Ep • The graph depicts an exothermic reaction. Endothermic reactions are also possible • H is the difference between initial and final Ep. It is -ve for exothermic,+ve for endothermic
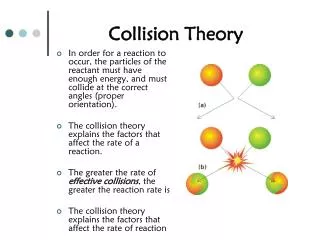
The collision theory • Related to the Ep graph is the “collision theory” - the idea that for molecules to react they must meet with sufficient force • Factors that affect reaction rate can be explained via the collision theory: • Increased temperature causes molecules to move faster (increased number of collisions per unit time and greater kinetic energy) • Increased concentration means more collisions • Homogenous reactions occur faster because reacting molecules collide more frequently • Catalysts decrease Ea, decreasing the amount of kinetic energy needed to overcome Ea
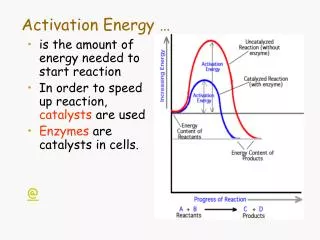
Fraction of molecules potential energy Kinetic energy Path of reaction Catalysts • Recall, catalysts speed a reaction • This can be explained by the Ek or Ep graphs • In both, the catalyst works by lowering the Ea: • Catalysts speed forward and reverse reactions • However, most reactions favour the side that has the lowest potential energy (most stable) • Catalysts are heterogenous or homogenous • They provide a substrate (p. 768) for a reaction or they can bond temporarily to a molecule, increasing the odds of a favourable meeting
Transition state lab: purpose Purpose: 1) to visualize an activated complex, 2) to observe the influence of a catalyst We will be examining the following reaction: NaKC4H4O6(aq) + H2O2(aq) CO2(g) + … Procedure: • Turn hot plates immediately to medium heat • Get a 10 mL graduated cylinder, a 100 mL beaker, a test tube, and a rubber stopper. • Weigh1.7gNaKC4H4O6.Addtobeakeralong with 10 mL distilled H2O. Swirl to dissolve. • Add 4.5 mL of 10% H2O2 to beaker. Heat. • Get 5 mL of CoCl2 but don’t add it yet.
Transition state lab: procedure Procedure: • As soon as tiny bubbles start to form and rise, remove the beaker from the hot plate. Add the CoCl2 at this point. • Record your observations (in order to answer the questions). Clean up – wash everything down the drain, wipe off your lab bench. Questions: answer on a separate sheet of paper • Look at the chemical equation that represents the reaction. What physical sign will there be when a reaction is occurring? • The products of the reaction are colourless. What colour are the reactants?
Transition state lab: conclusions Questions: read 18.11 (pg. 767 – 769) • What was the catalyst in the lab? What colour was it? Is it homogenous or heterogeneous? • At the beginning of step 5, both reactants were present; why was there no reaction? (Illustrate with a Ek diagram). • Why is the reaction still slow after heat is added? (illustrate using the Ek diagram) • Was the catalyst a different colour at the end of the experiment than at the beginning? • What colour was the activated complex? • Illustrate the affect the catalyst had on the reaction (using both Ek and Ep diagrams)
Fraction of molecules Kinetic energy Answers • The production of CO2 (bubbling) is a physical sign that the reaction is occurring • The reactants are colourless • CoCl2 was the catalyst in the lab (pink, homogenous) • There was no reaction because the Ea was not reached (Illustrate with a Ek diagram). • The reaction still slow after heat is added because very few molecules exceed Ea.
Fraction of molecules potential energy Kinetic energy Path of reaction Answers • The catalyst was the same colour at the end of the experiment (catalysts don’t change). • The activated complex was green • Illustrate the affect the catalyst had on the reaction (using both Ek and Ep diagrams) For more lessons, visit www.chalkbored.com