Download
1 / 16
160 likes | 245 Views
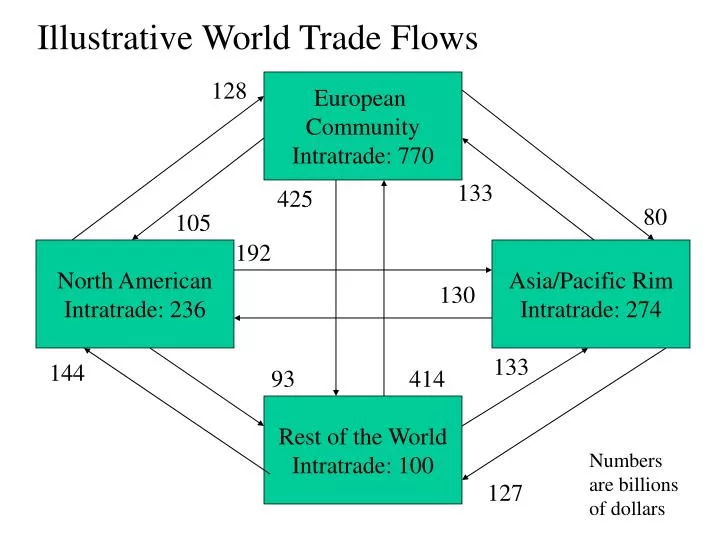
128. European Community Intratrade: 770. Illustrative World Trade Flows. 133. 425. 80. 105. 192. North American Intratrade: 236. Asia/Pacific Rim Intratrade: 274. 130. 133. 144. 93. 414. Rest of the World Intratrade: 100. Numbers are billions of dollars. 127.

E N D
128 European Community Intratrade: 770 Illustrative World Trade Flows 133 425 80 105 192 North American Intratrade: 236 Asia/Pacific Rim Intratrade: 274 130 133 144 93 414 Rest of the World Intratrade: 100 Numbers are billions of dollars 127
Protectionism and World Trade Protectionism Tariffs Quotas Increase Profits Limit Supply Decreased Global Trade
Exports of goods and services as a percentage of GDP, selected countries, 1996
Study the alphabetical list of countries below. Then rank them from highest to lowest in terms of which are the most important countries for U.S. exports. CountryRank Belgium & Luxembourg Canada France Germany Japan Mexico Netherlands South Korea Taiwan United Kingdom
The 10 most important countries for U.S. exports, 1991 CountryRank Imports(billions $) Canada 1 $85.1 Japan 2 $48.1 Mexico 3 $33.3 United Kingdom 4 $22.1 Germany 5 $21.3 South Korea 6 $15.5 France 7 $15.4 Netherlands 8 $13.5 Taiwan 9 $13.2 Belgium and Luxembourg 10 $10.8
Principal U.S. exports and imports of goods, 1996 (in billions of dollars)
U.S. trade exports to and imports from Canada and Mexico
Results of Hoover’s study of consumer preferences in automatic washers in four Western European countries
Seller International Marketing Channel of Distribution Seller’s int’l Marketing Headquarters Channels between Nations Channels within Foreign Nations Final Consumer
International comparison of the percent of U.S. software package sales that are illegal