Download
1 / 8
80 likes | 88 Views
The presentation will walk you through descriptive and inferential statistic measures, including a simple scenario, key measures and applications of descriptive and inferential statistic's.

E N D
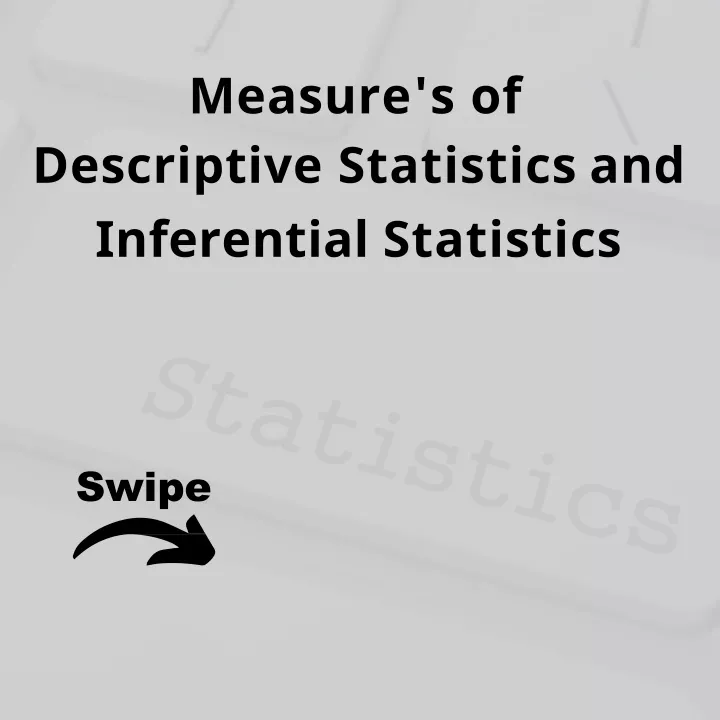
Measure's of Descriptive Statisticsand InferentialStatistics Swipe
Introduction 25 Descriptivestatisticsarenumbersthat areusedtosummarizeanddescribe 20 15 data. The word "data" refers to the information that has been collected from an experiment, a survey, a historical record,etc. 10 5 0 Item1 Item2 Item3 Item4 Item5 50 Inferential statistics is a set of data taken from the population to represent the population. Inferential statistics uses a random sample of data taken from a population to describe and make inferences about thepopulation. 40 30 20 10 0 Item1 Item2 Item3 Item4 Item5
Example Descriptivestatistics Rawdata Descriptivestatistics Inferentialstatistics
Measures of DescriptiveStatistics Frequencydistribution Measures of central tendency Measures of position Measures of variability Graphical representation Correlationco-efficient
Measures of InferentialStatistics Non- Parametric Parametric Kolmogrov-smirnov Mann-whitney Median Spearman rankcorrelation T-test ANOVA Chi-square
Applications of DescriptiveStatistic It gives information that describes the data in some detailedmanner. Organize, analyze and present data in ameaningful way. To describe asituation. Descriptive statistic are concerned withdescribing the characteristics of frequencydistribution. Charts, graphs andtables.
Applications of inferentialStatistic To makes inferences about population usingdata drawn from thepopulation. To compare data, text hypothesis andmake predictions (Estimation orparameters). To explain the chance of occurrence of anevent. It attempts to reach the conclusion to learnabout thepopulation.
Topics for nextPost Measure of Central Tendency Measure of variability Hypothesis Test,Confidence Interval and RegressionAnalysis Stay Tunedwith