Download
1 / 40
400 likes | 489 Views
Restructuring Cities for Efficient Service Delivery. Vivek Srivastava WSP-SA ASCI-WBI Program on “Strengthening Urban Management - Unlocking the Potential of Indian Cities” Hyderabad January 24 2003. Productive Cities as Centers of Growth. The Context.

E N D
Restructuring Cities for Efficient Service Delivery Vivek Srivastava WSP-SA ASCI-WBI Program on “Strengthening Urban Management - Unlocking the Potential of Indian Cities” Hyderabad January 24 2003
The Context • A New Global SettingUrban Millennium • A New Management Challenge Creating World Class-Cities
Important Implication • Municipal service delivery cannot be seen in isolated context; • How municipal services come together to serve the city-economy; • Managing cities to be credit worthy • National economic growth and poverty reduction efforts will be increasingly determined by the productivity of cities and towns
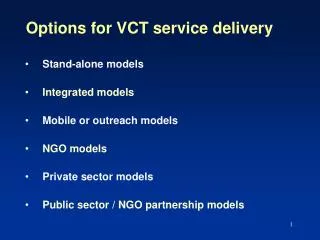
Which Model of City Governance? • Metropolitan Government • Metropolitan Government with Economic Decentralization • Metropolitan Government with Political Decentralization
Key Differences • In the politically decentralized model, political and fiscal power is shared between the metropolitan and municipal tier.The metropolitan tier and municipalities jointly keep each other in check. • In the economic decentralized model, political and fiscal powers resides at the metropolitan level. The regions are de-concentratedarms of the metro unlike the independent municipalities of the first model
Similarities • Fiscal and political power is devolved to city governments. • Both models adopt corporate structures for the financing and delivery of municipal services with user-charges. • In both models the city has share ownership with expected dividends from the corporations. • Danger of political deadlock.
Evaluating Decentralization Political Stability Quality of Public Services Equity Horizontal (inter-state/city) Within state/city Impact of Macro-economic Stability
The Problem • Chronic poor performance is the rule rather than the exception in many publicly run municipal services • Technical losses • Poor cost recovery • Subsidies do not reach the poor
Current Situation - Water • Technical and commercial losses • “filling the leaking bucket” • 3 hour connectivity • Poor quality of service • High coping costs • Low Tariffs • Fiscally and financially unsustainable
Policy • Define the Objectives • 24-hour supply • Clean water • Extended Access • Define the Rules Regulation Delivery • Enforce the Rules • Monitor Compliance • Regulate Pricing • Deliver the Service • Play by the Rules Why?The Judge, The Jury and the Executioner are the Same! .
Goals • 24 hour delivery • coverage for by all: geographic and household • quality • pressure
Elements of Separation • Government ownership of some form • Public good nature of water • Sustainability as a resource: time and quality • Attacking poverty • Business approach to delivery • Private good nature of water • Demand driven; customer responsive • Independent regulation
Johannesburg’s Original Structure • 4 municipalities and one metro • Fragmented: no economies of scale • Duplication of service delivery • Typical line function responsibility • No integrated planning
IGOLI 2000 • Program A: Utilities • Water and Sanitation, Power Distribution, Waste Management • Program B: Agencies • Roads and Stormwater, Parks and Cemeteries • Program C: Privatize • Metro Gas, Airport, Stadiums, Power Generation • Program D: Corporatize • Zoo, Bus Co., Market, Property and Project • Program E: Traditional Governance • Admin, HR, Planning, Budget, Finance, Community Services, Welfare, etc.
Metropolitan Government • Spatial Planning • Fiscal Budget • Local Economy Water & Sanitation • Slum-upgrading • Primary Health • Peoples Center R1 Waste Delivery Electricity Contract R2 IT Fiscal Surplus Transport/Roads R11 Restructuring of Johannesburg
Why PSP? • Efficiency • Flexibility in procurement • Appropriate incentives • Technology • Investment • Accountability
The potential PPP • A public asset holding corporation (AHC) with • state and municipal shareholders • A private operating company (PO) with • with shareholder agreement with domestic and international partners • holding a concession contract with AHC • Appropriate mix of public and private finance • Appropriate division of risks between AHC and PO • A competent autonomous regulator
State Govt. Municipalities shareholders Asset Holding Company contract Service delivery obligations Access by poor Pricing and subsidies O&M Human resource management Investment expansion Regulator Operating Company
Need of Alternative Management Model • Too big to be managed by communities • Large and dense enough to benefit from economies of scale offered by piped water systems • Too small and dispersed to be managed by a conventional utility
Possible option • Regional or multi-town utilities • Advantages • Economies of scale in management • Minimize transactions costs of contracting • Viable volumes of business
Criteria for Clubbing • Large enough population base Clusters of 1-2 million • “Manageable” overall distance • Within a watershed boundary • Voluntary or prescribed
International Examples: UK • Economies of scale up to population of 1 million • 10 large utilities with population of 2-10 million • 15 smaller utilities with population base of 250,000 to 1.2 million • Jurisdiction based on watershed boundaries
International Examples: France • WSS responsibility of Local Governments • Voluntary “Syndicates” • 15500 undertakings for 37000 municipalities – 2/3 per grouping • SEDIF manages water services for 144 municipalities and about 4 million customers
Regional Utility Shareholders: ULBs, State government ASSET HOLDING COMPANY Contract Private sector operator Town 1 Town 2 Town 3
Rules of Engagement • “Top down”: Statutorily create the regions and enforce all ULBs to be members e.g. England, Scotland • Need to ensure compatibility with 74th amendment • “Bottom up”: Voluntary association e.g. France • Slow • How to create incentives for association?
Governance • Vesting O&M control of water related assets by lease (or otherwise) to AHC/AMC • Share ownership proportional to asset value • Voting rights possibly allocated on a more equitable basis • State government as shareholder, coordinator and arbiter • Rules of entry and exit
Current situation: Status of the poor • How are the poor being served today? • Free water through stand posts and tankers (10 -20 lpcd) • 15% of population not covered by public system • Is Water Really Free? • Poor quality water with adverse health implications • Time, physical energy, drudgery and space costs
PSP and the Poor • A sound and competitively procured PPP will benefit the poor through efficiency gains • In addition, benefits to the poor can be further enhanced by specific contractual design • The Manila example: • 600,000 poor connected within two years • The poor now consume three times more water at half the price • The poor now have more time for productive work and more living space
Maximizing the benefits for the poor • Designing Pro-poor Contracts: • Service expansion obligations designed to include the poor • Some form of subsidy (or finance) for one-time connection fee • Gradual phasing of prices: transition finance • Concessionaire responsible for providing water by alternative means where private connections are not feasible or during a transition period