Download
1 / 10
100 likes | 230 Views
Review of t -test. Numerator quantifies the difference between the experimental conditions Denominator is based on a weighted average of the variances within the two groups

E N D
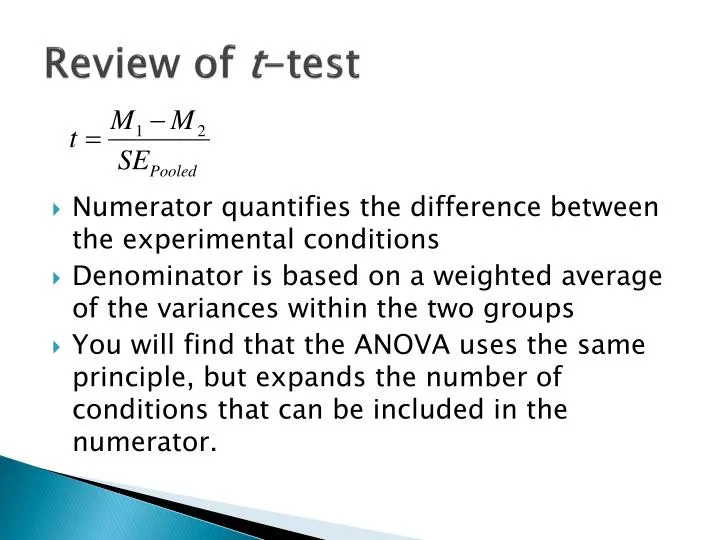
Review of t-test • Numerator quantifies the difference between the experimental conditions • Denominator is based on a weighted average of the variances within the two groups • You will find that the ANOVA uses the same principle, but expands the number of conditions that can be included in the numerator.
We can test the assumption about equal variances in the independent samples t-test. • From Chocolate Choo-choo data: • S2Auditory = 4.087 • S2Image = 1.583 • F(1,5) = 4.087/1.583 = 3.987, p>.05 • C.V. = 6.61 • We are safe making the assumption about equal variances in these two samples.
Reasons for the shape • The ratio of two equal variances is 1. • Variances cannot be negative so the F-ratios cannot take on a negative value. • In theory, these ratios can take on infinitely large values, but will only do so on rare occasions.
Like the t-distributions, the F-distributions are really a family of distributions that are determined by the degrees of freedom. • Notice that now we have two degrees of freedom to deal with (numerator and denominator).
Assumptions of the between groups ANOVA • At least two independent samples, but typically more than two. • The samples are drawn from approximately normal distributions. • The samples are drawn from populations with equal variances. • Sound familiar?
The Rationale for ANOVA from an Example • Within groups variance = Error + Individual Differences • Between groups variance = Error + Individual Differences + ETOH effects • If ETOH effects = 0 then Between/Within = 1 • The within groups variance is simply the average or the variances within each group. • We can calculate the Between groups variance as Σ(MGroup-GM)2/(NGroups-1) • We have to multiply this sum by n to convert from SE2 to S2.
Group 1 Group 2 Group 3 Group 4 n 25 25 25 25 M 94 101 124 105 s 24 28 31 25 s^2 576 784 961 625 An example
The calculations • Grand Mean = 106 • Variance Between ((94-106)2+(101-106)2+(124-106)2+(105-106)2)/3 = ??? • MSBetween = 164.67*25 = ??? • MSWithin = (576+784+961+625)/4 = ??? • F = 4116.667/736.5 = ??? • dfBetween = 4-1 = 3 • dfWithin = 24*4 = 96 • C.V.alpha=.05 = 2.70 • F(3,96) = 5.590, p < .05