Download
1 / 3
30 likes | 117 Views
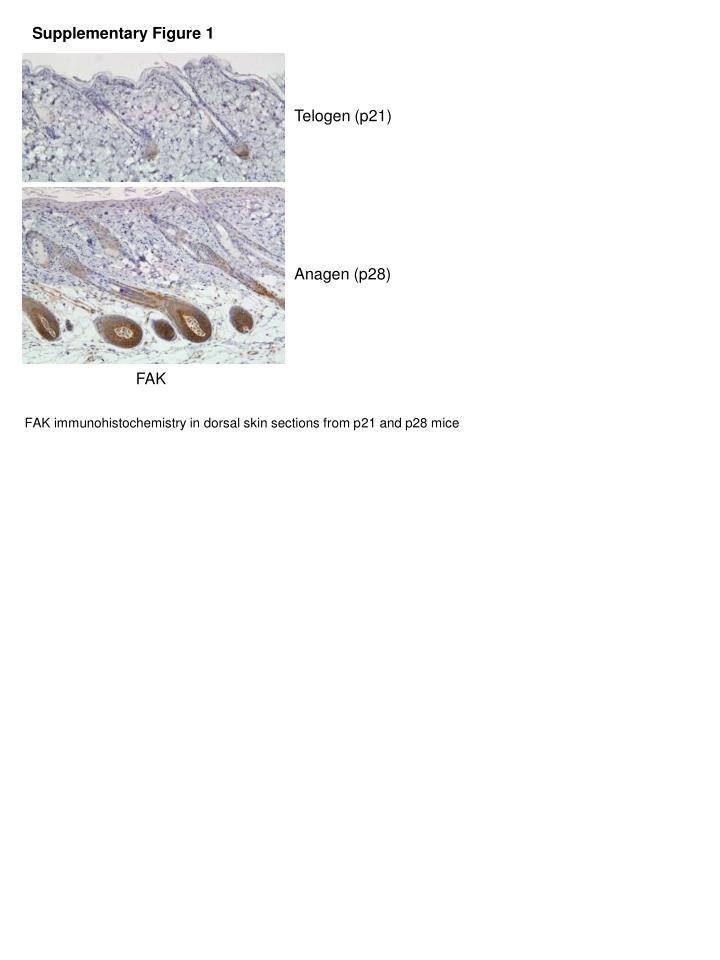
Supplementary Figure 1. Telogen (p21). Anagen (p28). FAK. FAK immunohistochemistry in dorsal skin sections from p21 and p28 mice. p=0.1770. p=0.9310. Area (pixels) BrdU positive staining. Supplementary Figure 2. A. B. K14/ Src fl / fl. p=0.2439. Area (pixels) BrdU

E N D
Supplementary Figure 1 Telogen (p21) Anagen (p28) FAK FAK immunohistochemistry in dorsal skin sections from p21 and p28 mice
p=0.1770 p=0.9310 Area (pixels) BrdU positive staining Supplementary Figure 2 A B K14/Srcfl/fl p=0.2439 Area (pixels) BrdU positive staining Fyn-/-, Yes+/+ + TPA Fyn+/+. Yes-/- + TPA Fyn-/-, Yes+/+ Fyn+/+. Yes-/- Fyn+/+, Yes+/+ + TPA (A) LRCs from Fyn+/+/Yes+/+,Fyn-/-/Yes+/+ and Fyn+/+/Yes-/- mice were counted following TPA or vehicle treatment as indicated (n=5 mice per group, Mann-Whitney U test, p=0.1770 and p=0.9310 comparing TPA treatment of mice Fyn+/+/Yes+/+with Fyn-/-/Yes+/+ and Fyn+/+/Yes-/- mice respectively). (B) LRCs from K14/Src-/- mice were counted following 4OHT and TPA treatment as indicated (n=5 mice per group, Mann-Whitney U test, p=0.2439 comparing TPA treatment of 4OHT or vehicle treated K14/Src-/- mice). Fyn+/+, Yes+/+
Supplementary Figure 3 Expression ratio 4OHT Wnt3a Untreated Wnt3a + 4OHT Keratinocytes were isolated from K14 mice and treated with 4OHT and/or Wnt3a and qRTPCR carried out using axin2 specific primers. Values represent the ratio of gene expression relative to the housekeeping gene beta-2-microglobulin.