Download
1 / 39
390 likes | 484 Views
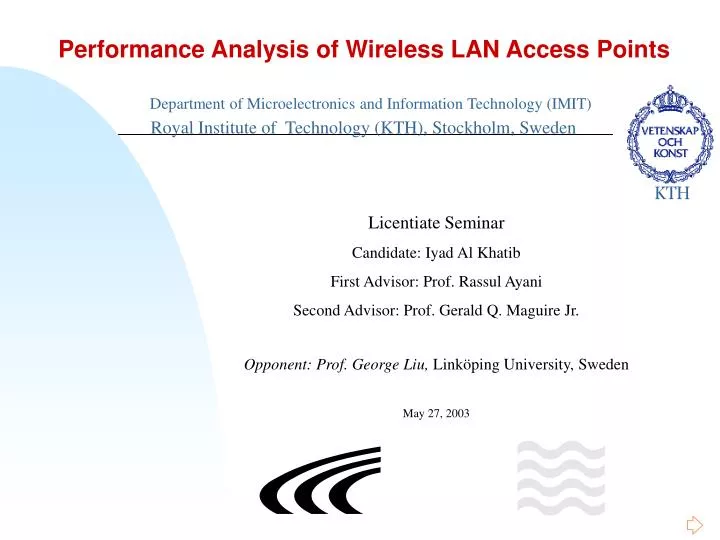
KTH. Performance Analysis of Wireless LAN Access Points. Department of Microelectronics and Information Technology (IMIT). Royal Institute of Technology (KTH), Stockholm, Sweden. Licentiate Seminar Candidate: Iyad Al Khatib First Advisor: Prof. Rassul Ayani

E N D
KTH Performance Analysis of Wireless LAN Access Points Department of Microelectronics and Information Technology (IMIT) Royal Institute of Technology (KTH), Stockholm, Sweden Licentiate Seminar Candidate: Iyad Al Khatib First Advisor: Prof. Rassul Ayani Second Advisor: Prof. Gerald Q. Maguire Jr. Opponent: Prof. George Liu, Linköping University, Sweden May 27, 2003
Outline 1. Motivation 2. Access Point (AP) Modeling 3. Experimental Setup 4. Test Design 5. Results (Queuing Model) 6. AP as a Data Link 7. Feedback Model for AP Throughput 8. Conclusions 9. Open Issues and Future Work
1. Motivation • With the technological progression in data communications, I see an obvious success for high speed networks • The increase in Wireless LAN (WLAN) deployment is evident, and users show interest in getting connected without being tethered by a wire. • Currently, most WLAN systems use an Ethernet backbone, i.e. communication is via access points, rather than ad-hoc networking. • The PCC (www.pcc.lth.se) project indicates that the trend will be toward even more access points attached to LANs. • A high proportion of services utilized by mobile users are hosted on machines attached to the wired infrastructure. • To the best of our knowledge, there has been no logical model for WLAN APs.
2. Access Point (AP) Modeling • Seeking to model a wireless LAN access point (WLAN AP) as a system of Reference. • For technical objects, Webster reads: A system is “a group of devices or artificial objects or an organization forming a network especially for distributing something or serving a common purpose.” • A Model is a representation of a system aimed at studying the system • Types of Models: Physical and Logical. • Necessary to define the boundary line, which depends on the desired parameters of the study of the model.
2. AP Modeling 2.1. AP Queuing System • We seek to model the processing in a wireless LAN access point (WLAN AP), hence, a set of assumptions was made. • Logically, we isolate the AP, define the events that occur, and the parameters related to these events. • Three types of events exist: external and internal events. • two external events: arrival,departure, and noise (eliminated). • one internal event: enter-service • Whether packets arrive from the wired or wireless sides, the model considers them as arriving packets. • Similarly, packets leaving the system are considered as departing packets regardless of the medium they go out on. • Since the number of packets in the system changes when a packet enters or when a packet departs from the system, then it is a discrete-event system.
2.2. AP Queuing Model Ta = Arrival time Td = Departure time Response time (R.T.) = Td - Ta Si = Service time of packet i Wi =Waiting time of packet i Si and Wi calculated using our algorithms. Si and Wi calculated using our special algorithms. 2. AP Modeling 2.1. AP Queuing System • We define two traffic flows through the AP: • Downlink: from Ethernet to WLAN • Uplink: from WLAN to Ethernet • Analyses of experimentally recorded time stamps of arrival time and departure time values showed that the AP can be modeled as a queuing system with a single queue and a single server. • Ri can be easily calculated. • However, Wi and Si are logical model parameters that can not be easily measured. Hence, we designed the SSTP (Simple Service Time Producer) algorithm.
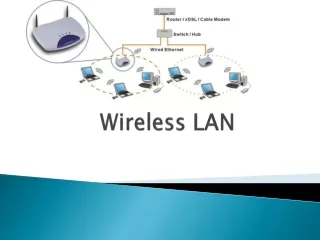
3. Experimental Setup The testbed consists of Ethernet PCs (EPCs), WLAN PCs (WPCs), WLAN AP, and a Sniffer PC (SPC). • Linux-2.2.16 • MGEN 3.2 (UDP) • tcpdump • ORINOCO Client Manager • Lucent WavePoint II • Lucent AP2000 • 11Mbps • Controlled environment
4. Test Design • Our tests consist of two main parts: single-source-to-single-sink (SS) and multiple-sources-to-multiple-sinks (MM). • Each part is made up of downlink and uplink tests. • We call the experiment in a cluster an experimental test run (ETR). The ETR is the basic unit of tests. • In each ETR, we send a stream of identical UDP datagrams from the sender(s) to the receiver(s).
4. Test Design • For each ETR, we vary the size of the packets to be sent in a stream via increasing the payload of the UDP datagram by 32 bytes. • The maximum number of bytes we used in the UDP payload was 1472, because sizes beyond the MTU may result in fragmentation. • The headers and Inter-Frame Spaces are thoroughly calculated before sending any traffic stream, because there is a major difference between the link frames of the Ethernet and the WLAN (in this case IEEE 802.11b).
DATA SIFS Destination (receiver) ACK 4. Tests Design 4.1. The Link Scenario • In IEEE802.11, there are different link scenarios for transmission (controlled by the AP). We have used the most common one, namely DSSS with a DCF MAC. • WLAN link layer interference is described by four link layer parameters. IEEE 802.11b overhead delay can be compared to that of Ethernet (9.6μs), as shown: DIFS Source (WPC or AP) time 50μs for DIFS, ~4μs preamble, MAC header and trailer in DATA time 10μs for SIFS, ~5μs link layer ACK period
4. Tests Design 4.2. SSTP Algorithm SSTP-1.3 Ri = Wi + Si = Td - Ta
5. Results (Queuing Model) • Outcomes of tests show that the assumption of single server, single FIFS queue holds true for downlink and uplink traffic tests. • For the WLAN APs we have tested, the delay on the uplink is always smaller than on the downlink.
AP1 (Lucent WavePoint II) Average Service Time (microsec) AP2 (Lucent AP2000) Average Service Time (microsec) 5. Results (Queuing Model) 5.1. Directional Service-Time Delay • Uplink is faster than downlink. • Differs with different APs (compare performance).
5. Results (Queuing Model) 5.2. Service-Time Formula • The key result is an analytic solution for the average service-time of a wireless LAN AP: • P = IP_payload in bytes • Sp = average service time (s) for a packet with IP payload of P bytes • So = service time (s) for a packet with 40B IP payload • r = incremental difference in sec. • So is calculated by averaging the service times calculated in the different experiments, and r is calculated using linear regression of service times of different packet sizes. • So and r are the characteristic parameters of the AP.
5. Results (Queuing Model) 5.3. Analysis of Directional Service-Time • We introduce the notion of the Uplink Downlink Contrast: UDC(,x) = |UST(,x)-DST(,x)| where, • is the brand of the access point, • UST(, x) is the Uplink Service-Time of a packet with payload x bytes, for AP "", and • DST(, x) is the Downlink Service-Time of a packet with payload x bytes, for AP "".
5.3. Analysis of Directional Service-Time 5.3.1. UDC of two APs • AP1 is Lucent WavePOINT-II • AP2 is Lucent AP2000
5.3. Analysis of Directional Service-Time 5.3.2. Convergent UDC Definition. A WLAN access point, , is said to have a convergent UDC if and only if: as x increases, UDC(, x) decreases, where x is the payload in bytes.
Theoretical point of intersection. In this case it is around 2200 bytes 5.3. Analysis of Directional Service-Time 5.3.2. Convergent UDC plot • If extrapolated (dotted line), the UDC meets the horizontal axis
5.3. Analysis of Directional Service-Time 5.3.3. Divergent UDC Definition. A WLAN access point, , is said to have a divergent UDC if and only if: as x increases, UDC(, x) increases, where x is the payload in bytes.
5.3. Analysis of Directional Service-Time 5.3.3. Divergent UDC plot
5.4. Buffer Size Estimation • We are not aware of a careful analysis of buffer size in current APs. • In order to estimate the buffer size, we construct a set of experiments that purposely try to induce packet loss due to the lack of buffer capacity. • We designed and implemented the Buffer Size Estimator (BSE) algorithm that detects when a packet is lost and makes use of the SSTP algorithm for extracting some parameters for the buffer size estimation.
5.4. Buffer Size Estimation 5.4.1. BSE Algorithm
5.4. Buffer Size Estimation 5.4.2. BSE Results APa is Lucent/ORINOCO WavePOINT-II APb is ORINOCO AP500
6. AP as a Data Link • Throughput is an important QoS parameter of the AP (link throughput is studied) • Inspired by the power of Packet-pair in FIFO-queuing networks, I looked at the AP as a data communication link. • Packet-pair in FIFO-queuing networks makes use of a two-packet logical model. whose parameters are the difference in arrival times of two identical packets sent from the same source to the same destination. • Using the Link model, the throughput of a WLAN AP can be well estimated.
6. AP as a Data Link • Consider the WLAN AP as a data communication Link:
6. AP as a Data Link The packet pair property.
6. AP as a Data Link • Adaptive Bandwidth of AP Link Model: Mbps Mbps, for IPv4
6. AP as a Data Link Downlink max ba Downlink min ba 1480B 40B
6. AP as a Data Link Uplink max ba Uplink min ba 1480B 40B
C(bits) C R R(sec.) + E Gf - H + - 7. Feedback Model for AP Throughput Two feedback control models for the AP throughput: uplink feedback model and downlink feedback model
8. Conclusions • Using our model and analysis, we can compare the performance of different brands of WLAN APs. • A mathematical model for WLAN AP was presented. Our experiments showed that the assumption of a single server, single FIFS queue is correct. • The time to serve a packet going from WLAN to Ethernet is less than the time to serve an identical packet going from Ethernet to WLAN. • We defined the absolute value of the difference as the UDC (Uplink-Downlink Contrast) as a QoS parameter. • UDC can be characterized as either convergent or divergent.
8. Conclusions Cont’d • The AP is looked upon as a link with adaptive-bandwidth bounded by two limits: the upper adaptive-bandwidth bound and the lower adaptive-bandwidth bound. • The bandwidth of the link model of the AP was analyzed and found to be an increasing linear fractional transformation of payload.
9. Open Issues and Future Work • Noise in the WLAN medium had not been considered • The case of multiple access points has not been investigated. • AP throughput is presented without discussing the effect of multiple nodes on the wireless medium and QoS degradation. • The percentage of packets that are successfully transmitted by an AP was not tackled.
9. Open Issues and Future Work • Studying of IEEE 802.11 anomalies. • Investigating AP throughput model in relationship to associated nodes. • Extending the analyses to bridges and routers. • Developing a simulator (work in progress). • Traffic shaping can be used to allow emulation of a given access point, based on analyzing a set of measurements of a real access point. • Testing the C++ programs against a Linux machine running packet forwarding code (such as traffic shaping). • Using the service time analysis to estimate the response time. • Investigating the relationship between the AP brand and the percentage of successfully received packets.
ACKNOWLEDGMENTS Thanks to my advisors, Prof. Rassul Ayani and Prof. Gerald Q. Maguire Jr. Also to Daimler Sweden AB for supporting us with WLAN APs, and for their interest. ..and to all, who helped.
Erratum Page 90, Section 6.3, Beginning of paragraph should be Figure 29
Thank you for your attention, ..and have a bright day!