Download
1 / 36
400 likes | 647 Views
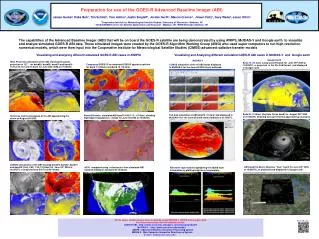
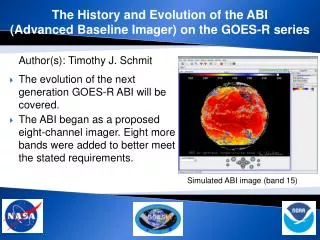
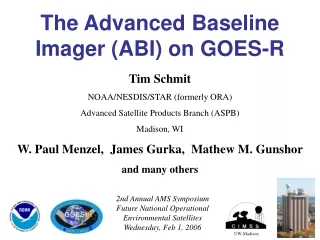
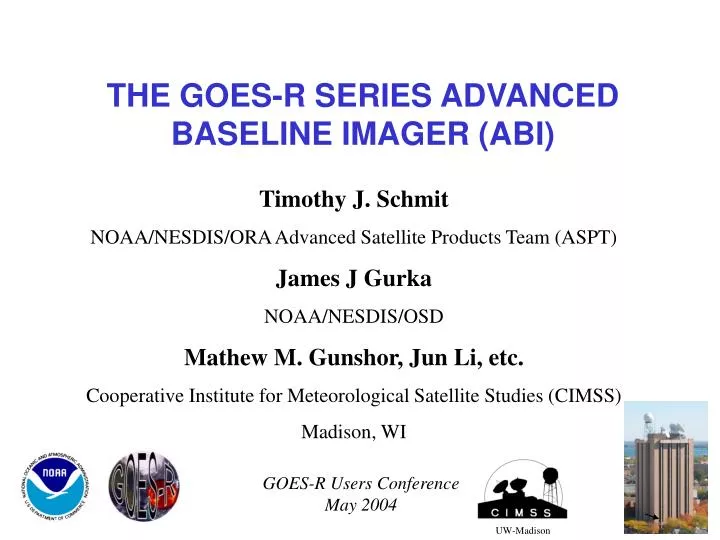
THE GOES-R SERIES ADVANCED BASELINE IMAGER (ABI). Timothy J. Schmit NOAA/NESDIS/ORA Advanced Satellite Products Team (ASPT) James J Gurka NOAA/NESDIS/OSD Mathew M. Gunshor, Jun Li, etc. Cooperative Institute for Meteorological Satellite Studies (CIMSS) Madison, WI.

E N D
THE GOES-R SERIES ADVANCED BASELINE IMAGER (ABI) Timothy J. Schmit NOAA/NESDIS/ORA Advanced Satellite Products Team (ASPT) James J Gurka NOAA/NESDIS/OSD Mathew M. Gunshor, Jun Li, etc. Cooperative Institute for Meteorological Satellite Studies (CIMSS) Madison, WI GOES-R Users Conference May 2004 UW-Madison
Limitations of Current GOES Imagers • Missing spectral bands • Low spatial resolution • Regional/Hemispheric scan conflicts • Eclipse and related outages The ABI (Advanced Baseline Imager) is the next generation operational geostationary imager. The GOES-R/ABI era will begin in 2012.
ABI Current Spectral Coverage 16 bands 5 bands Spatial resolution 0.64 mm Visible 0.5 km Approx. 1 km Other Visible/nearIR 1.0 km n/a Bands (>2 mm) 2 km Approx. 4 km Spatial coverage Full disk 4 per hour Every 3 hours CONUS 12 per hour ~4 per hour Visible On-orbit calibrationYes No Low-light imaging Yes No The Advanced Baseline Imager:
ABI spatial coverage rate versus the current GOES Imager ABI coverage in ~5 minutes Current GOES coverage in 5 minutes • There are two anticipated scan modes for the ABI: • full disk images every 15 minutes + CONUS images every 5 minutes + mesoscale. • Full disk every 5 minutes.
AVIRIS spectra Snow, Phase Cirrus Part. size Veg. Haze Clouds Visible and near-IR channels on the ABI Radiance The current GOES has only one visible band.
While there are differences, there are also many similarities for the spectral bands on MET-8 and the Advanced Baseline Imager (ABI). Both the MET-8 and ABI have many more bands than the current operational imagers.
Weighting Functions for the IR channels on the ABI Weighting functions for the standard atmosphere at a local zenith angle of 40 degrees.
ABI Bands Based on experience from: Current GOES Imagers
ABI Bands Based on experience from: MSG/AVHRR/Sounder(s) Current GOES Imagers
ABI Bands Based on experience from: MSG/AVHRR/Sounder(s) MODIS, Aircraft, etc Current GOES Imagers
Select Products clouds/fog solar insolation aerosol products hurricane intensity cloud phase, cloud particle size snow, ice volcanic ash/ SO2 land/sea surface temperature atmospheric motion fires cloud height/emissivity haze/dust NDVI (Normalized Difference Vegetation Index) severe weather signatures turbulence ozone radiances, cloud mask rainfall Products that are highlighted are included in this talk
Linden_haze_0.47 µm (ABI spectral band from AVIRIS data) Smoke
Three-color composite (0.64, 1.6 and 11 µm) shows the low cloud over the snow and the water versus ice clouds. Snow Low cloud
Visible and near-IR channels on the ABI The ABI visible and near-IR bands have many uses.
Volcanic Ash Plume: 11-12 and 8.5-11 μm images UW/CIMSS One day after the Mt. Cleveland eruption 20 February 2001, 0845 UTC Simulated ABI (11-12 μm) Simulated ABI (8.5-11 μm) Poster…Ellrod
SO2 calculations from F. Prata Slightly shift, toward larger wavenumbers, the two narrow ABI water vapor bands to better discriminate the SO2 peak.
Simulated GOES-R ABI Image Difference TOMS Carn Upper-level SO2 poster…Schreiner et al. Plume Simulated IR spectrums for “normal” and “SO2 enriched” atmosphere and spectral response functions Differenceand GOES-R ABI SRF
GOES-R ABI will improve fire detection and characterization useful for air quality monitoring and forecasting GOES-8 Wildfire ABBA fire product for the Pacific Northwest Date: August 17, 2001 Time: 2200 UTC FIRES Smoke NAAPS Model Aerosol Analysis for the continental U.S. Date: August 18, 2001 Time: 1200 UTC Poster…Schmidt et al. and S. Kondragunta et al.
Poster…Schmidt; Miller ABI “Natural Color” Image (from MODIS) This represents a “best case” for generating an “natural color” Red-Green-Blue” composite image, given the MODIS 550 nm data from this image was used to build the Look Up Table (LUT) to simulate the “green” component from the other spectral bands. The HES-Coastal Water will have a 550 nm band. Hurricane Isabel on September 18, 2003 from MODIS
13.3 m allows for better cloud-top information estimates GOES-12 Imager -- Cloud Top Pressure
Mountain Waves in WV channel (6.7 µm) 7 April 2000, 1815 UTC Simulated ABI Actual GOES-8 Mountain waves over Colorado and New Mexico were induced by strong northwesterly flow associated with a pair of upper-tropospheric jet streaks moving across the elevated terrain of the southern and central Rocky Mountains. The mountain waves appear more well-defined over Colorado; in fact, several aircraft reported moderate to severe turbulence over that region. Both images are shown in GOES projection. UW/CIMSS
GOES-10 4 minus 11 μm Difference ABI 4 minus 11 μm Difference Fog -- Based on GOES Imager 3.9 µm 5 March 2001 - Nocturnal Fog/Stratus Over the Northern Plains Both images are shown in the GOES projection. Fog UW/CIMSS ABI image (from MODIS) shows greater detail in structure of fog.
Higher Spatial Resolution GOES Channels Simulated ABI (from MODIS) concentric anvil-layer waves Enhanced “V”: IR windows May 25, 2000 Enhanced “V” Actual GOES http://cimss.ssec.wisc.edu/goes/misc/000525.html
Satellite-derived rainfall estimates Satellite-derived precipitation estimates will be improved for GOES-R: - higher spatial resolution (better depiction of cold cores) - more frequent images (offers cell growth information) - improved cloud height (with multiple bands and HES) - new ABI bands (phase information, better cloud detection) - better NEdT’s - better navigation/registration Poster…Kuligowski
Radiances and Cloud Mask This includes both the navigated, calibrated pixels, as well as a clear-sky mask. For example, MODIS uses 17 of the 36 MODIS bands to identify the presence of clouds. For the ABI: Potentially all bands would be used, depending on the location and time of day. Plus, both clear and cloudy radiances can be used for Numerical Weather Prediction (NWP) – along with a host of products (winds, cloud-top information, snow cover, etc.) Poster…Frey et al.
Combined GOES-8 & -10 Imager Long Wave Band (11.0 m) Sample: Combined GOES-8 & -10 Imager Water Vapor Band (6.7 m) Clear-Sky Brightness Temperature (CSBT Image)
Poster…Wimmers Current routine GOES and ABI temporal sampling Regional View ABI This simulated GOES-R ABI loop was created by morphing between two actual GOES images."Morphing" describes a broad category of digital image algorithms used to create smooth, seamless transitions between two or more images.
MET-8 • The advanced multi-spectral geostationary operational imager, Met-8, can be used to prepare for the ABI.
Spatial Temporal resolution resolution Cloud clearing Improved products will be realized from combinations of ABI and HES (Hyperspectral Environmental Suite) data (IR and Visible/near IR on the HES-Coastal Water)! ABI HES Spectral coverage Surface emissivity Spectral resolution
CIMSS Much improved spatial coverage with the HES Sounder Current GOES Sounder coverage in one hour GOES-R HES Sounder coverage in one hour Cloud Top Pressure
GOES R Observational Requirements*Preliminary Instrument Allocation ABI – Advanced Baseline Imager SEM – Space Environment Monitor HES – Hyperspectral Environmental Suite SXI – Solar X-Ray Imager GLM – GOES Lightning Mapper * Does not reflect individual geographic coverage requirements. Prepared By: L.O’Connor 04/23/2004
“0.47m” “0.64m” “0.86m” “1.38m” “1.61m” “2.26m” “3.9m” “6.19m” “6.95m” “7.34m” “8.5m” “9.61m” “10.35m” “11.2m” “12.3m” “13.3m” Using MODIS, MET-8 and AIRS to simulate the spectral bands on the Advanced Baseline Imager (ABI)
“0.47m” “0.64m” “0.86m” “1.38m” “1.61m” “2.26m” “3.9m” “6.19m” “6.95m” “7.34m” “8.5m” “9.61m” “10.35m” “11.2m” “12.3m” “13.3m” Similar bands on the GOES-12 Imager
Summary -- ABI • ABI addresses Imager concerns by: • increasing spatial resolution • - closer to NWS goal of 0.5 km IR • scanning faster • - temporal sampling improved • - more regions scanned • adding bands • - new and/or improved products enabled • Simulations (from MODIS, AIRS, NAST-I, MSG and AVIRIS) show that the ABI addresses needs for cloud, moisture, air quality and surface products. • Every product from the current GOES imager will be improved! • Every band on the ABI will be used for a number of products. • ABI will allow exciting new products from geostationary orbit, especially when combined with data from the HES.
More information -- ABI • ABI Research Home page (with a link to all these links): • http://cimss.ssec.wisc.edu/goes/abi/ • ABI Simulated images from NASA AIRS Direct Broadcast: • http://cimss.ssec.wisc.edu/goes/abi/airs_broadcast/aniairs.html • GOES and MODIS Galleries: • http://cimss.ssec.wisc.edu/goes/misc/interesting_images.html • http://terra.ssec.wisc.edu/~gumley/images.html • ABI Documentation from NASA: • http://goes2.gsfc.nasa.gov/abihome.htm • ABI Simulated Spectral Response functions: • ftp://ftp.ssec.wisc.edu/ABI/SRF