Download
1 / 59
610 likes | 726 Views
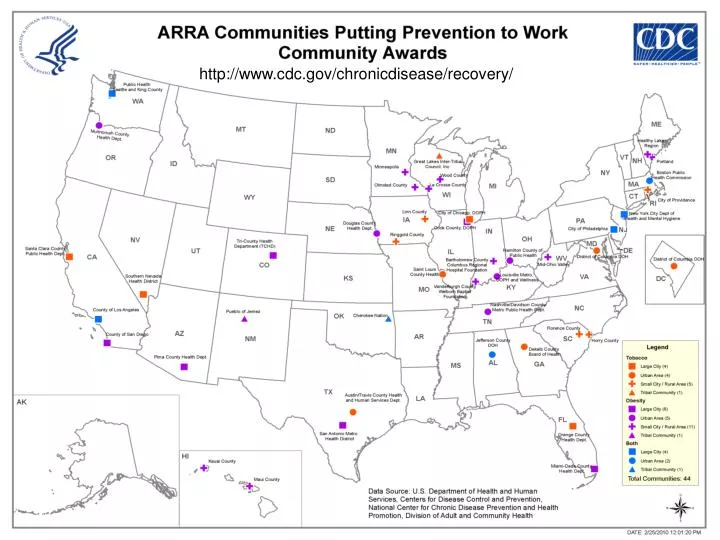
http://www.cdc.gov/chronicdisease/recovery/. Communities Putting Prevention to Work . Wayne H. Giles, MD, MS Director Division of Adult and Community Health National Center for Chronic Disease Prevention and Health Promotion June 8, 2010 CPPW Action Institute, St. Louis, MO. Overview .

E N D
Communities Putting Prevention to Work Wayne H. Giles, MD, MS Director Division of Adult and Community Health National Center for Chronic Disease Prevention and Health Promotion June 8, 2010 CPPW Action Institute, St. Louis, MO
Overview • Why focus on chronic disease and underlying risk factors? • Why policy, systems, and environmental change strategies? • Why now?
Heart Disease Cancer Stroke Chronic lower respiratory diseases Unintentional Injuries Diabetes Alzheimer’s disease Pneumonia/influenza Kidney Disease Percentage (of all deaths) National Center for Health Statistics. Deaths: Final Data for 2006. Hyattsville, MD: US Department of Health and Human Services; 2008. Leading Causes of DeathUnited States, 2006
Ten Great Public Health Achievements 1900 - 1999 • Vaccination • Motor-vehicle safety • Safer workplaces • Control of infectious diseases • Decline in deaths from coronary heart disease and stroke • Safer and healthier foods • Healthier mothers and babies • Family planning • Fluoridation of drinking water • Recognition of tobacco use as a health hazard
Alarming Health Disparities • Heart disease death rates 30% higherfor African-Americans than whites; stroke death rates 41% higher • Diabetes higher among American Indians and Alaska Natives (2.3 times),African Americans (1.6 times),and Hispanics (1.5 times) • About 30% of Hispanics and 20% of African Americans lack a usual source of health care compared with less than 16% of whites
“Disparities in health care are among the nation’s most serious health care problems. Research has extensively documented the pervasiveness of racial and ethnic disparities.” Institute of Medicine, 2002
Economic Impact • Chronic conditions account for 75% of the $2 trillion in health care costs • Smoking costs $96 billion per year • Obesity-related costs $147 billion peryear
Why Chronic Disease?Something Can Be Done- Preventable Risk Factors
Chronic Diseases and Related Risk Factors Leading Causes of Death* United States, 2000 Actual Causes of Death† United States, 2000 Tobacco Heart Disease Poor diet/ Physical inactivity Cancer Alcohol consumption Stroke Chronic lower respiratory disease Microbial agents Toxic agents Unintentional Injuries Motor vehicles Diabetes Firearms Pneumonia/influenza Alzheimer’s disease Sexual behavior Kidney disease Illicit drug use 0 5 10 15 20 0 5 10 15 20 25 30 35 Percentage (of all deaths) Percentage (of all deaths) * Miniño AM, Arias E, Kochanek KD, Murphy SL, Smith BL. Deaths: final data for 2000. National Vital Statistics Reports 2002; 50(15):1-120. † Mokdad AH, Marks JS, Stroup DF, Gerberding JL. Actual causes of death in the United States, 2000. JAMA. 2004;291(10):1238-1246.
Healthy Food Has Gotten More Expensive, Junk Food Cheaper Fresh fruits and vegetables Consumer price index Price Index (1982-84 = 100) Sugar and sweets Carbonated drinks Data from Bureau of Labor Statistics; represent U.S. city averages for all urban consumers in January of each year
Obesity Trends* Among U.S. AdultsBRFSS, 1990 (*BMI ≥30, or ~ 30 lbs. overweight for 5’ 4” person) No Data <10% 10%–14%
Obesity Trends* Among U.S. AdultsBRFSS, 1991 (*BMI ≥30, or ~ 30 lbs. overweight for 5’ 4” person) No Data <10% 10%–14% 15%–19
Obesity Trends* Among U.S. AdultsBRFSS, 1992 (*BMI ≥30, or ~ 30 lbs. overweight for 5’ 4” person) No Data <10% 10%–14% 15%–19%
Obesity Trends* Among U.S. AdultsBRFSS, 1993 (*BMI ≥30, or ~ 30 lbs. overweight for 5’ 4” person) No Data <10% 10%–14% 15%–19%
Obesity Trends* Among U.S. AdultsBRFSS, 1994 (*BMI ≥30, or ~ 30 lbs. overweight for 5’ 4” person) No Data <10% 10%–14% 15%–19%
Obesity Trends* Among U.S. AdultsBRFSS, 1995 (*BMI ≥30, or ~ 30 lbs. overweight for 5’ 4” person) No Data <10% 10%–14% 15%–19%
Obesity Trends* Among U.S. AdultsBRFSS, 1996 (*BMI ≥30, or ~ 30 lbs. overweight for 5’ 4” person) No Data <10% 10%–14% 15%–19%
Obesity Trends* Among U.S. AdultsBRFSS, 1997 (*BMI ≥30, or ~ 30 lbs. overweight for 5’ 4” person) No Data <10% 10%–14% 15%–19% 20%–24%
Obesity Trends* Among U.S. AdultsBRFSS, 1998 (*BMI ≥30, or ~ 30 lbs. overweight for 5’ 4” person) No Data <10% 10%–14% 15%–19% 20%–24%
Obesity Trends* Among U.S. AdultsBRFSS, 1999 (*BMI ≥30, or ~ 30 lbs. overweight for 5’ 4” person) No Data <10% 10%–14% 15%–19% 20%–24%
Obesity Trends* Among U.S. AdultsBRFSS, 2000 (*BMI ≥30, or ~ 30 lbs. overweight for 5’ 4” person) No Data <10% 10%–14% 15%–19% 20%–24%
Obesity Trends* Among U.S. AdultsBRFSS, 2001 (*BMI ≥30, or ~ 30 lbs. overweight for 5’ 4” person) No Data <10% 10%–14% 15%–19% 20%–24% 25%–29%
Obesity Trends* Among U.S. AdultsBRFSS, 2002 (*BMI ≥30, or ~ 30 lbs. overweight for 5’ 4” person) No Data <10% 10%–14% 15%–19% 20%–24% 25%–29%
Obesity Trends* Among U.S. AdultsBRFSS, 2003 (*BMI ≥30, or ~ 30 lbs. overweight for 5’ 4” person) No Data <10% 10%–14% 15%–19% 20%–24% 25%–29%
Obesity Trends* Among U.S. AdultsBRFSS, 2004 (*BMI ≥30, or ~ 30 lbs. overweight for 5’ 4” person) No Data <10% 10%–14% 15%–19% 20%–24% 25%–29%
Obesity Trends* Among U.S. AdultsBRFSS, 2005 (*BMI ≥30, or ~ 30 lbs. overweight for 5’ 4” person) No Data <10% 10%–14% 15%–19% 20%–24% 25%–29% ≥30%
Obesity Trends* Among U.S. AdultsBRFSS, 2006 (*BMI ≥30, or ~ 30 lbs. overweight for 5’ 4” person) (*BMI ≥30, or ~ 30 lbs. overweight for 5’ 4” person) No Data <10% 10%–14% 15%–19% 20%–24% 25%–29% ≥30%
Obesity Trends* Among U.S. AdultsBRFSS, 2007 (*BMI ≥30, or ~ 30 lbs. overweight for 5’ 4” person) No Data <10% 10%–14% 15%–19% 20%–24% 25%–29% ≥30%
Obesity Trends* Among U.S. AdultsBRFSS, 2008 (*BMI ≥30, or ~ 30 lbs. overweight for 5’ 4” person) No Data <10% 10%–14% 15%–19% 20%–24% 25%–29% ≥30%
Childhood Obesity is Also Epidemic Prevalence of Obesity Among U.S. Kids Tripled in a Generation (BMI ≥ 95th percentile) Source: CDC, NHANES
How to weigh yourself and get the most accurate result. I can’t believe I was doing it wrong all these years
Factors that Affect Health Smallest Impact Largest Impact Examples Eat healthy, be physically active Counseling & Education Rx for high blood pressure, high cholesterol, diabetes Clinical Interventions Immunizations, brief intervention, cessation treatment, colonoscopy Long-lasting Protective Interventions Fluoridation, 0g trans fat, iodization, smoke-free laws, tobacco tax Changing the Context to make individuals’ default decisions healthy Poverty, education, housing, inequality Socioeconomic Factors
Focusing on Dose DOSE = REACH x INTENSITY Intensity Deconstructed: • Exposure • Potency What It Looks Like: 50% healthy vending slots ban on unhealthy foodswhole school reform school + corner stores Walk to school daywalk to school yearcomplete streets complete streets + school physical activity Source: Kaiser Permanente
Adult per Capita Cigarette Consumption Environmental and Policy Changes in the US 1900-1990 Thousands per year Fairness Doctrine messages on radio and television Nonsmoker’s rights movement begins First Medical reports linking smoking and cancer US Surgeon General’s first report Federal cigarette tax doubles End of WW II Broadcast advertising ban Great Depression 1900 1910 1920 1930 1940 1950 1960 1970 1980 1990 Year
Source: NHIS, Tax Burden on Tobacco, 2009, and author’s calculations Note: green data points for prevalence are interpolated assuming linear trend
18.9% • 350,000 fewer adult smokers • >100,000 fewer smoking-related deaths in future years 11% Policy Change: Producing Results - New York City Warn about the dangers of smoking Monitor adult smoking prevalence Protect people from tobacco smoke 21.5% 22% 20% Raise taxes on tobacco (City & State) 16.9% 19.2% 18% 18.3% 18% 17.5% 16% Monitor youth smoking % of New York City Smokers 15.8% 15% 14% 12% 8.5% 10% 8% 2008 1994 1995 1998 1999 2003 2007 1993 1996 1997 2000 2001 2002 2004 2005 2006
Changing the Places that TouchPeople’s Lives Pittsburgh, PA Healthy foods in after school care Los Angeles, CA Moratorium on fast food Pinellas County, FL Daycare licensing PE requirement; PE in schools 5x/week
Addressing health equity through policy, systems, and environmental change • “We must endeavor to eliminate, so far as possible, the problem elements which make a difference in health among people” W.E.B Dubois, 1899 The Philadelphia Negro
Health Care Services are Only One Piece of the Picture …. Reference: Institute of Medicine. (2003). The Future of the Public’s Health in the 21st Century. Washington, D.C.: National Academies Press. Original source: Dahlgren G, Whitehead M. 1991. Policies and Strategies to Promote Social Equity in Health. Stockholm, Sweden: Institute for Futures Studies.
Obesity Rates in Community X, 2010 Obesity burden inversely correlated with income
Community X’s Draft Community Action Plan Goal: Establish 8 farm stands to increase community’s access to healthy vegetables and fruits
Farm Stands in Community X’s CAP = Farm stand
Community X’s Revised Community Action Plan Goal: Establish 15 farm stands--At least 7 farm stands in low income neighborhoods where obesity burden is greatest
Farm Stands in Community X’s Revised Community Action Plan = Farm stand
Community X: Ensuring Effectiveness of Revised Community Action Plan • ADDED ACTIVITIES: • Enable farm stands to accept food stamp vouchers • Build community buy-in through targeted media approaches • Incorporate tracking of program impact of populations with disproportionate burden to monitor and evaluate program success