Download
1 / 44
440 likes | 580 Views
Integrating Concepts in Biology. PowerPoint Slides for Chapter 15: Cells at the Ecological System Level Section 15.1 : Can parasites survive in more than one host species? 15.2 How do diseases spread? 15.3 What causes phytoplankton to produce a red tide?

E N D
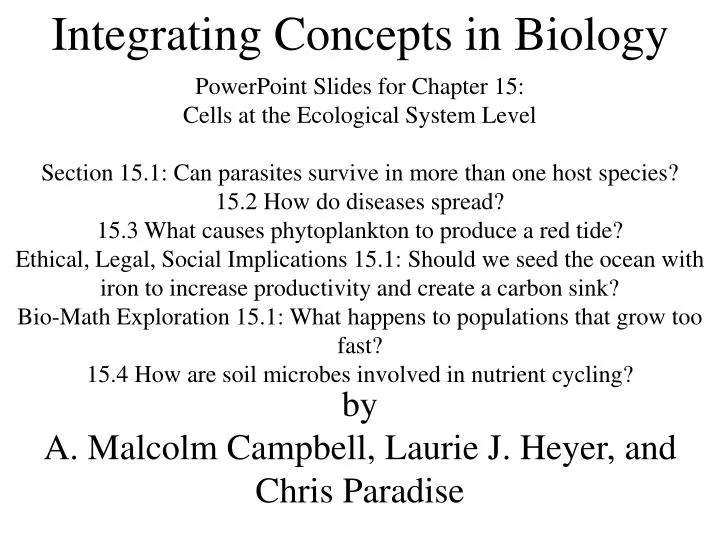
Integrating Concepts in Biology PowerPoint Slides for Chapter 15: Cells at the Ecological System Level Section 15.1: Can parasites survive in more than one host species? 15.2 How do diseases spread? 15.3 What causes phytoplankton to produce a red tide? Ethical, Legal, Social Implications 15.1: Should we seed the ocean with iron to increase productivity and create a carbon sink? Bio-Math Exploration 15.1: What happens to populations that grow too fast? 15.4 How are soil microbes involved in nutrient cycling? by A. Malcolm Campbell, Laurie J. Heyer, and Chris Paradise
Red tide off the coast of Washington State Figure UN15.1
Giardia lamblacells Figure 15.1
Prevalence of diarrhea and Giardia in a human population Table 15.1
Percentage of clinical symptoms in children tested for Giardia Table 15.2
Percentage of children in day-care centers with Giardia cysts and trophozoites. Figure 15.2
Giardiainfection in rats Figure 15.3
Distribution of Giardia lambliacell types in gerbils in four sections of the intestines Figure 15.4
New cases of Giardia among a group of campers Figure 15.5
Summary data from campers suffering from diarrheal outbreak Table 15.3
Prevalence of Giardia in beaver and nutria captured in east Texas Figure 15.6
A schematic representation of the SARS coronavirus Figure 15.7
SARS outbreaks in Guangdong Province, China between 11/2002 and 2/2003 Figure 15.8
Antibodies against coronavirus in SARS and control patients Table 15.4
Animal species tested for presence of SARS coronavirus Figure 15.9
Humans testing positive for antibodies against SARS coronavirus isolated from a palm civet Table 15.5
Species that tested positive for human SARS coronavirus Figure 15.10
Phylogenetic analysis of spike gene sequence of coronaviruses Figure 15.11
Nucleotide differences in the spike gene among coronaviruses isolated from animals in a southern Chinese market and from human SARS patients Table 15.6
SARS cases by week of onset Figure 15.12
Location of data collection stations along the coast of the Yellow Sea Figure 15.13
Nutrient concentrations of water sources and nutrient inputs into coastal Yellow Sea habitats Figure 15.14
Percentage of total toxic algal bloom events that occurred in each month Figure 15.15
Harmful algal blooms in Chinese coastal waters Figure 15.16
Environmental parameters measured during maximum bloom of A. minutumover three years in an estuary Figure 15.17
Changes in cell densities of A. minutumduring algal bloom in an estuary Figure 15.18
Concentrations and uptake rates of nutrients before, during, and after a bloom of A. minutum Figure 15.19
Daily surface irradiance and % PAR at 1 m depth before, during, & after A. minutumbloom Figure 15.20
Bio-Math Exploration 15.1: What happens to populations that grow too fast? IQs • 15.1a: Assuming an initial population of P0 algae, write the equation for the number of algae after one hour, if the population triples each day. What if the population increases by 30%, or 350%, per day? How would your equations change if you had Pt algae on day t, and wanted to know the number of algae on day t+1? • 15.1b: Examine the behavior of the population with the default value of r = 1. What does this value of r mean is happening to the population each day? Can you identify this graph as modeling a type of growth you have seen before? • 15.1c: Experiment with different values of r greater than 1 to see if you can produce population growth patterns that are similar to algal tides. What other patterns do you observe as r increases?
% mortality of different species in response to exposure to cells of one of two dinoflagellatesat different concentrations Figure 15.21
Documented occurrences of paralytic shellfish poisonings associated with algal blooms Figure 15.22
Sampling locations for A. fundyenseand shellfish toxicity Figure 15.23
Density of Alexandriumcells and shellfish toxicity scores for annual surveys Figure 15.24
Ethical, Legal, and Social Implications Box 15.1 Should we seed the ocean with iron to increase productivity and create a carbon sink? IQs • Should humans consider this as a legitimate mitigation strategy? Argue for or against iron fertilization of oceans, based on science, as well as the projected ethical, environmental and social impacts. • If humans employ this strategy, who should be allowed to do it? Should it be considered a for-profit enterprise?
Experimental design of nitrogen study Figure 15.25
Nitrogen content of aboveground portions of crops Figure 15.26
Source of nitrogen for three crops Table 15.7
Soil N used and returned in three initial crops and total N in harvested sorghum plants Table 15.8
Root nodules on peanut Figure 15.27
Structure of legume nodules Figure 15.28
Nitrogen content of chickpea shoots grown hydroponically Figure 15.29
Response of chickpeas to two fertilizer conditions or rhizobia inoculation Figure 15.30
The nitrogen cycle Figure 15.31
Accumulation of nitrite in bacterial cultures provided with ammonium sulfate Figure 15.32