Download
1 / 41
410 likes | 416 Views
Complex Survey Samples. Explaining the Miracle: Statistics and Analysis in Public Health APHEO Conference 2007, October 14-16, 2007. Susan Bondy, Department of Public Health Sciences, University of Toronto. Outline. Goals of complex survey analysis What is simple, what is complex

E N D
Complex Survey Samples Explaining the Miracle: Statistics and Analysis in Public Health APHEO Conference 2007, October 14-16, 2007 Susan Bondy, Department of Public Health Sciences, University of Toronto
Outline • Goals of complex survey analysis • What is simple, what is complex • Issues and implications of complexities • Working with software • Tips for working with expert analysts
What we report from surveys • Descriptive statistics • Mean, median, counts, totals • Measures of difference, association and effect • % diff, risk diff, OR, RR, rho, etc. • Always reported with expression of variance • Margin of Error (MOE or +/- part) • Confidence intervals • Point estimate versus variance
Meet two users of survey data The Modeller The Describer
The describer Population inference is #1 ALWAYS need true pop’n rep. samples Sometimes just descriptivestatistics(rates) Interest in comparisons: monitoring and surveillance (e.g., across time, space, sub-populations) Consistency is important The modeller Hypothesis tests are #1 Analyses simulate controlled experiments Rarely need true pop’n rep. samples Interest in comparison: Replication of experiments Differences between studies more interesting Extending and testing theory
Simple Random Sample • Selection into sample is entirely at random • Each member of pop has same chance of being in the sample • No strata, no clusters, self-weighting • Statistically efficient (all observations are independent – tightest margins of error)
Complex designs • Selection by cluster • Stratification • Probability sample weights • Finite population correction • Worst of all: • Mishmashes of all the above • & where you can’t have the information
Cluster sampling • E.g., people by FAMILY, students by CLASS, teeth by MOUTH , etc., • Now WELL recognized as a problem • Non-independence means loss of statistical power (variance understated, if ignored) • Need: • New statistics textbooks • More expensive software …will return to software options
Repeat after me: “Failure to account for non-independence of observations, in the analysis, will always result in an underestimation of variances” • Confidence intervals narrower… • p-values smaller… • results ‘less conservative’ … … than they should be
What is: stratification? • Division of the target population into groups or layers from which samples are drawn • e.g., Plan for reports on • Youth • Smaller pop’n regions
Goals of stratification • For PLANNED descriptions of sub-populations • E.g., regions, age-groups • For design correction: • To prevent extreme unrepresentativeness • e.g., empty groups; extreme weights • To improve precision of the overall (or full pop) estimates Implications…
They come as a pair WEIGHTS Stratification
Impact of weights in analysis • Impacts precision – a huge DEFF issue • Other model problems • E.g., can create highly influential observations • Restricts software and analysis choices When, why of weights?
Repeat after me: “You knew clustering affected variance estimates and had to be taken into account… Sometimes WEIGHTS have an even bigger bad effect on precision !” Always use software and procedures specific to complex survey data, even when weighting is your only complexity.
But wait a minute, I’ve been told unweighted is sometimes better
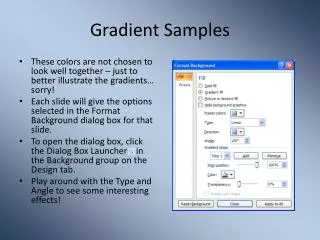
Scenario A People up-weighted People down-weighted Weighted or unweighted is same slope !
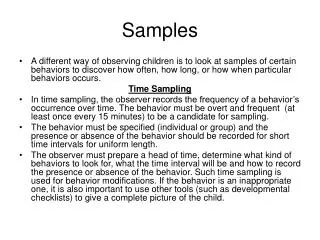
Scenario B Something correlated with relative weights is associated with a different slope Low educ. Readiness to quit Over educated Exposure to materials Weighted
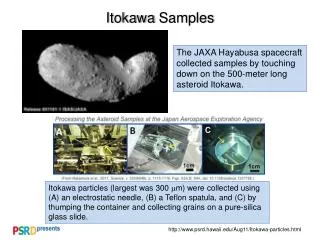
Scenario C Annoyance ratings (%) Distance from airport (km) Weighted slope Unweighted slope
Scenario C Annoyance ratings (%) Distance from airport (km) Weighted or unweighted curve
Modeller’s adage • If weighted and unweighted differ then, both are wrong • There must be a complex relationship, or better model, to find and describe
Scenario B Something correlated with relative weights is associated with a different slope Low educ. Readiness to quit Over educated Exposure to materials Pop’n weighted is TRUE population estimate of ‘net’ or ‘average’ effect
Model all possible interactions with age, sex and geography strata? Yes, • Do look for effect modification where there are good grounds (show net and specific data) No, • In hundreds of age*sex*region strata, some random variation by chance • In large samples lots of meaningless interactions can be detected • Pop average effect is still pop average effect
Message so far… Can never ignore: • Cluster sampling • Weighting So, HOW to analyze data?
“Taylor-Series” aka “Linearized” variance estimation 2 most commonly used for complex survey variance estimation “Bootstrap” Usually achieved using bootstrap replicate resampling weights
Taylor Series Complex linear equations to estimate corrected variance for every estimate • Requires assumptions about data ! • Normally distribution assumptions • Large sample sizes • Very difficult for user to know: • when limits are being pushed • When procedure is accepted or controversial • Requires full design information • Even more ‘approximate’ with more complex designs
Using “Taylor-series” type software 1) Use syntax (or even boxes) to declare the following: • Weight variable • Stratification variable • Group unit for cluster sampling • Primary sampling unit or PSU • (Ignore requests for finite population info) 2) Run your analysis as available in software • Using only ‘special’ commands for complex samples
Survey estimates • Prevalence = 13.0 (95% CI = 10.0-16.0) • Odds ratio = 2.1 (95% CI = 1.6-4.0) Usual weighted point estimate Variance calculated from a formula; substituted in things like CIs
Bootstrap variance weights • Sampling variability “observed” not calculated from a fixed formula • Felt to reflect “true” sampling variability, • As due to chance alone if survey really repeated an infinite number of times • Virtually free of assumptions • Tends to be more appropriate and conservative when assumptions for linearization fails • Very broadly applicable
Creation of BRR weights • Someone takes a lot of random COMPLEX sub-samples of the full survey dataset (~500 times) • The full algorithm for pop’n weighting is applied to each sub-sample • When obs not in sample, weight=zero • Rest re-weighted to reflect pop’n again • RESULT • 500 weights, • When applied to full dataset, simulates taking 500 samples again
Bootstrapping (with weights) • Point estimates taken from full sample • Mean = 13.0 • Same point estimate taken from 500 B.S. samples • Observed variability in 500 B.S. estimates becomes variance for mean of 13.0.
Survey estimates • Prevalence = 13.0 (95% CI = 10.0-16.0) • Odds ratio = 2.1 (95% CI = 1.6-4.0) Usual weighted point estimate Variance reflects OBSERVED variance in 500 estimates of prev. and OR.
Beware • Stick to procedures custom-designed for complex survey samples • Will handle weights properly • Will give useful statistics, such as DEFF • Bootstrapping without a set of BS weights • If you aren’t screaming in pain, you haven’t got it right
Tips for working in partnership • Get a geek to generate lots of useful sets of BS Weights for your survey • e.g., your favourite standard pop’n • Does take expertise, but done once benefits many many users • Get a nerd to do only your variance corrections for you • Use your favourite software and keep very detailed programs (recodes, restrictions, etc) • Have them repeat very defined results tables
Embargoed Not for release: Preliminary analyses pending adjustment of variance estimates to account for complex survey design