Download
1 / 28
360 likes | 834 Views
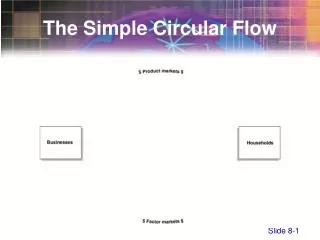
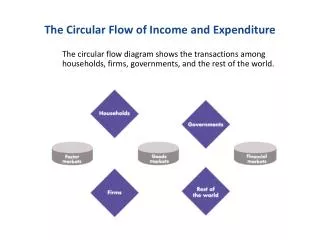
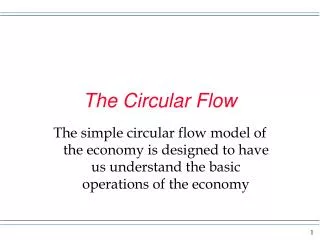
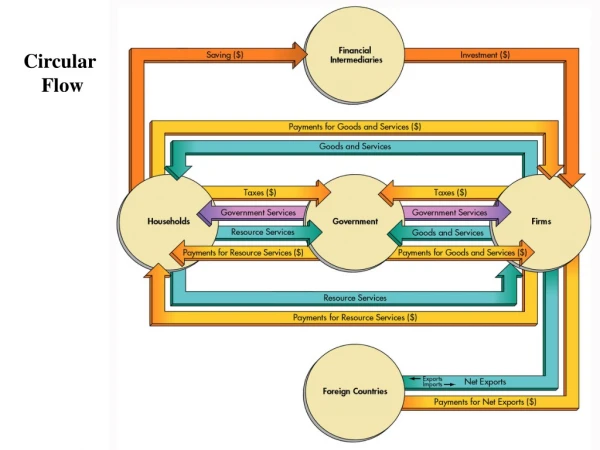
The Circular Flow of Income. Consumption of domestically produced goods and services (C d ). Factor payments. The circular flow of income. Firms. Households. THE CIRCULAR FLOW OF INCOME. Withdrawals net saving net taxes import expenditure Injections investment

E N D
Consumption of domestically produced goods and services (Cd) Factor payments The circular flow of income Firms Households
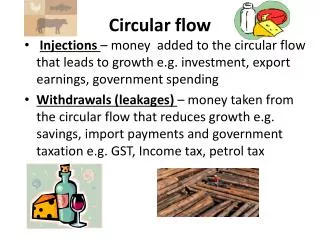
THE CIRCULAR FLOW OF INCOME • Withdrawals • net saving • net taxes • import expenditure • Injections • investment • government expenditure • export expenditure
Export expenditure (X) Investment (I) Government expenditure (G) BANKS, etc ABROAD GOV. Import expenditure (M) Net taxes (T) Net saving (S) The circular flow of income INJECTIONS Consumption of domestically produced goods and services (Cd) Factor payments WITHDRAWALS
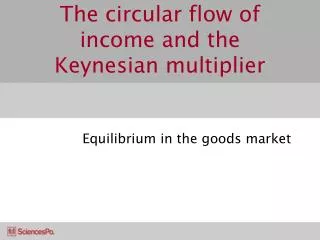
THE CIRCULAR FLOW OF INCOME • The relationship between injections and withdrawals • the links between them • planned injections may not equal planned withdrawals • Equilibrium in the circular flow • The circular flow and the four macroeconomic objectives
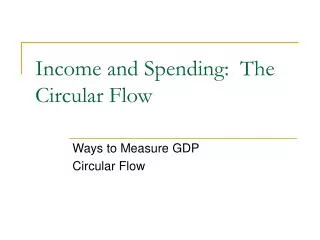
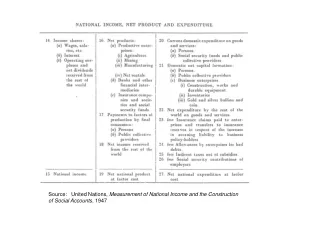
The National Economy Measuring National Income
MEASURING NATIONAL INCOME • The three ways of measuring GDP • the production method • the income method • the expenditure method
The circular flow of national income and expenditure (1) Production (2) Incomes (3) Expenditure
MEASURING NATIONAL INCOME • The product method • the problem of double counting • the measuring of value added • gross value added (GVA) • some qualifications • stocks • government services • ownership of dwellings • taxes and subsidies on products
UK GVA (product-based measure): 2001 0.9 4.7 17.5 5.4 12.2 3.4 8.0 0.8 24.0 4.8 13.0 5.2 100.0 Agriculture, forestry and fishing £8 241 m Mining, energy and water supply £41 378 m Manufacturing £153 132 m Construction £47 327 m Wholesale and retail trade; repairs £106 766 m Hotels and restaurants £29 359m Transport and communication £70 252 m Banking, finance, insurance, etc. £6 667 m Letting of property £209 839 m Public administration and defence £42 096 m Education, health and social work £114 069 m Other services £45 101 m Total GVA £874 227 m
UK GVA (product-based measure): 2001 0.9 4.7 17.5 5.4 12.2 3.4 8.0 0.8 24.0 4.8 13.0 5.2 100.0 Agriculture, forestry and fishing £8 241 m Mining, energy and water supply £41 378 m Manufacturing £153 132 m Construction £47 327 m Wholesale and retail trade; repairs £106 766 m Hotels and restaurants £29 359m Transport and communication £70 252 m Banking, finance, insurance, etc. £6 667 m Letting of property £209 839 m Public administration and defence £42 096 m Education, health and social work £114 069 m Other services £45 101 m Total GVA £874 227 m
UK GVA (product-based measure): 2001 0.9 4.7 17.5 5.4 12.2 3.4 8.0 0.8 24.0 4.8 13.0 5.2 100.0 Agriculture, forestry and fishing £8 241 m Mining, energy and water supply £41 378 m Manufacturing £153 132 m Construction £47 327 m Wholesale and retail trade; repairs £106 766 m Hotels and restaurants £29 359m Transport and communication £70 252 m Banking, finance, insurance, etc. £6 667 m Letting of property £209 839 m Public administration and defence £42 096 m Education, health and social work £114 069 m Other services £45 101 m Total GVA £874 227 m Percentage of GVA
UK GVA by category of income: 2001 63.6 27.3 6.9 2.2 100.0 Compensation of employees (wages and salaries) £556 371 m Operating surplus (gross profit, rent and interest of firms government and other institutions) £238 625 m Mixed incomes £60 073 m Tax less subsidies on production (other than those on products) plus statistical discrepancy £19 158m Total GVA £874 227m
UK GVA by category of income: 2001 63.6 27.3 6.9 2.2 100.0 Compensation of employees (wages and salaries) £556 371 m Operating surplus (gross profit, rent and interest of firms government and other institutions) £238 625 m Mixed incomes £60 073 m Tax less subsidies on production (other than those on products) plus statistical discrepancy £19 158m Total GVA £874 227m
UK GVA by category of income: 2001 63.6 27.3 6.9 2.2 100.0 Compensation of employees (wages and salaries) £556 371 m Operating surplus (gross profit, rent and interest of firms government and other institutions) £238 625 m Mixed incomes £60 073 m Tax less subsidies on production (other than those on products) plus statistical discrepancy £19 158m Total GVA £874 227m Percentage of GVA
UK GDP (product-based measure): 2001 GVA (gross value added at basic prices) £874 227m plus Taxes on products £120 499m less Subsidies on products £6 712m GDP (at market prices) £988 014m
UK GDP (product-based measure): 2001 GVA (gross value added at basic prices) £874 227m plus Taxes on products £120 499m less Subsidies on products £6 712m GDP (at market prices) £988 014m
UK GDP (product-based measure): 2001 GVA (gross value added at basic prices) £874 227m plus Taxes on products £120 499m less Subsidies on products £6 712m GDP (at market prices) £988 014m
UK GDP (product-based measure): 2001 GVA (gross value added at basic prices) £874 227m plus Taxes on products £120 499m less Subsidies on products £6 712m GDP (at market prices) £988 014m
UK GDP by category of expenditure, GNI and NNI: 2001 £million Consumption expenditure of households and NPISH (C) 655 265 Government final consumption (G) 190 663 Gross capital formation (I) 164 048 Exports of goods and services (X) 268 451 less Imports of goods and services (M)290 912 Statistical discrepancy 499 Gross domestic product (GDP) (at market prices) 988 014
UK GDP by category of expenditure, GNI and NNI: 2001 £million Consumption expenditure of households and NPISH (C) 655 265 Government final consumption (G) 190 663 Gross capital formation (I) 164 048 Exports of goods and services (X) 268 451 less Imports of goods and services (M)290 912 Statistical discrepancy 499 Gross domestic product (GDP) (at market prices) 988 014 plusNet income from abroad 5 756 Gross national income (GNI) 993 770
UK GDP by category of expenditure, GNI and NNI: 2001 £million Consumption expenditure of households and NPISH (C) 655 265 Government final consumption (G) 190 663 Gross capital formation (I) 164 048 Exports of goods and services (X) 268 451 less Imports of goods and services (M)290 912 Statistical discrepancy 499 Gross domestic product (GDP) (at market prices) 988 014 plusNet income from abroad 5 756 Gross national income (GNI) 993 770 lessCapital consumption (depreciation) -111 275 Net national income (NNI) 882 495
Macroeconomic equilibrium • In a very simple economy, it must be that: • Y = C + I • Y = C + S • C + S = C + I i.e. S = I • Actual savings are by definition equal to actual investment by it is by no means guaranteed that planned savings match planned investments • The saving and investment decisions are taken by various groups, and if there is a mismatch, instability may be generated
All income is consumed GNI = GNP = 100 Consumption = 100 Households Firms GNI = 100 What happens if households want to savepart of their income (S = 10) ?
Planned savings equal planned investments Consumption = 90 Households Firms S=10 I=10 Capital-market GNI = 100 Savings are a leakage (withdrawal) from thecircular flow
Households want to save more Consumption = 80 Households Firms S=20 I=10 Capital-market GNI = 100 There is an unplanned increase in inventoriessince households save more
Households want to save more Consumption = 40 Households Firms S=10 I=10 Capital-market GNI = 50 The equilibrium level of income is reducedas firms cut back on production.