Download
1 / 18
180 likes | 190 Views
Writing. Academic Writing. Allow about 20 minutes In TASK 1 candidates are presented with a graph, table ,chart or diagram and are asked to describe, summarise or explain the information in their own words.

E N D
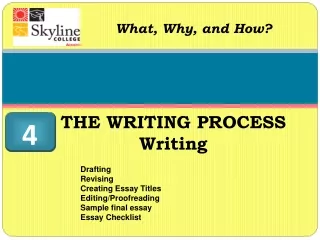
Academic Writing • Allow about 20 minutes • In TASK 1 candidates are presented with a graph, table ,chart or diagram and are asked to describe, summarise or explain the information in their own words. • They may be asked to describe or explain data describe the stages of a process, how something works or describe an object or event.
Task 2 • Candidates are asked to write an essay in response to a point of view, argument or problem.
General Training Writing • Task One • Candidates are presented with a situation and are asked to write a letter requesting information or explaining the situation. • The letter may be personal , semi-formal or formal in style. • Task Two • Candidates are asked to write an essay in response to a point of view , argument or problem. • The essay can be personal in style. • Topics are of general interest.
Skills Assessed • In both tasks , candidates are assessed on their ability to write a response which is appropriate in terms of content , the organisation of ideas and the accuracy and range of vocabulary and grammar.
Graphs and tables are the most common visuals used in IELTS Academic Writing Task 1. Since many students seem to have problems with analysing and describing them, here is our advice.
So, what should we do when we see a graph or table in IELTS Writing Task 1? • 1. We should analyse the task carefully before we start writing. Read the headings and note any labels or words. It is very important to understand the graph or table we are given. So, when looking at it, we should pay attention to the following details: • o What is the information or data in the graph or table about? (This information is normally supplied with the graph or table.) • What are the units of measurement used? • What is the area (place) involved? • What is the time-scale involved?
2.As soon as we know the answers to all these questions, we can identify the key features of the graph. Key features are the most noticeable, significant facts contained in the graph. We should select at least three key features, which will form the basis of our answer. We should not try to mention everything.
3. Now, we should write an introduction, describing the information given in the graph. The introduction should state what the main idea behind the graph or table is and can also include the units of measurement and the time frame.
4.As soon as our introduction is ready, we can start writing the main part. Here we need to summarize the information given in our graph or table in our own words, highlighting the key features and supporting these with the given figures. We should also make comparisons where appropriate, and provide an overview. It is necessary to remember that there should be a logical order of our paragraphs and the sentences should be linked to each other.
Combined tasks - more than one graph or table • If we are given 2-3 graphs or tables, it is necessary to understand the link that connects the two. The relationship between them may be a change over a period of time or it may be a possible cause and effect link. With the combined questions we should make an overall comment in our introduction which summarizes both graphs or tables and be sure to summarize both sources by reporting the key features of both. We should not forget to mention the relationship between them and make comparisons within and between both sources if relevant.
The conclusion should show an overview of the analysed graph or table. When everything is written, it is important to leave time to check our answer for errors. We should look at spelling, grammar and punctuation.
For both writing tasks, it is a good idea to jot down your ideas on the question sheet so that you know the outline of what you will be writing. It may take 2 or 3 minutes but the time spent is worth it. • Writing task 1 requires you to describe a graph / table / diagram in AT LEAST 150 words. So practise describing all kinds of graphs / tables. See how much of your writing is 150 words. If you write less that 150 words, you lose marks. If you write more, you are likely to make more mistakes. Try and stick to around 150 words.
Bar charts • Basically with a bar chart, you need to describe the bars and their values. • When describing a bar chart you first have to decide in what order to describe the bars, highest value to lowest value or lowest value to highest value . It may be a mixture of this. • If there are many bars , you can sometimes group together for description 1 or 2 or 3 bars which have similar or same values . If not the same , just describe the ones that are the most significant
Pie chart • Are relatively straightforward as they only usually have a few sections though this is not always the case. • You need to describe the segments and their values. • If many ,just describe the ones that are the most significant. • The values are often expressed in percentages
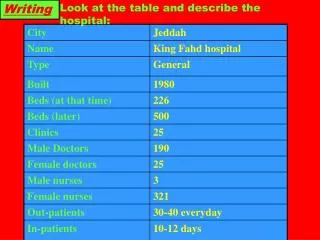
Tables • Can sometimes be tricky as they provide a lot of information which makes it difficult to describe every piece of information. • You have to decide and describe the values and sections that are the most significant.
Communicative Quality • This how you make yourself understood and whether the reader understands what you are saying. • Are you communicating well with the reader? • Are your ideas clear and easily understood by the reader?
Vocabulary and Sentence Structure • Grammar and choice of words • Whether the right grammar and words are used • Whether they are used at the right time , in the right place , and in the right way.