Download
1 / 1
20 likes | 156 Views
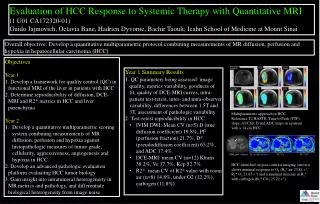
QUANTITATIVE MRI OF GLIOBLASTOMA RESPONSE Bruce Rosen, MD, PhD Athinoula A. Martinos Center for Biomedical Imaging, MGH. Reproducibility of MR parameters in tumors. Clinical Applications of new models of Dynamic Susceptibility Contrast MRI.

E N D
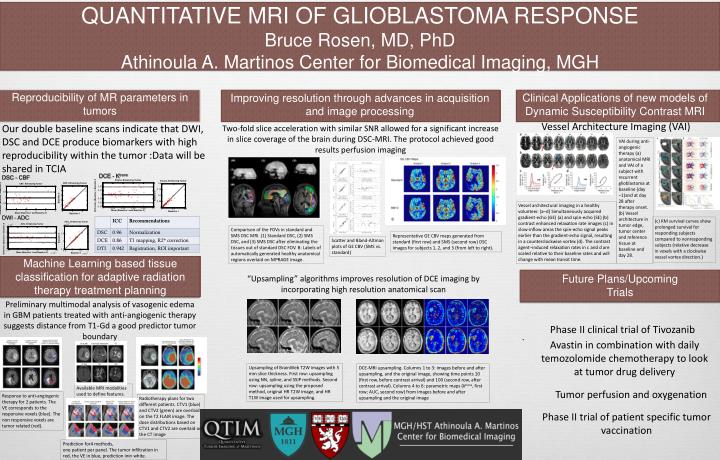
QUANTITATIVE MRI OF GLIOBLASTOMA RESPONSE Bruce Rosen, MD, PhD Athinoula A. Martinos Center for Biomedical Imaging, MGH Reproducibility of MR parameters in tumors Clinical Applications of new models of Dynamic Susceptibility Contrast MRI Improving resolution through advances in acquisition and image processing Vessel Architecture Imaging (VAI) Our double baseline scans indicate that DWI, DSC and DCE produce biomarkers with high reproducibility within the tumor :Data will be shared in TCIA Two-fold slice acceleration with similar SNR allowed for a significant increase in slice coverage of the brain during DSC-MRI. The protocol achieved good results perfusion imaging VAI during anti-angiogenic therapy (a) anatomical MRI and VAI of a subject with recurrent glioblastoma at baseline (day −1)and at day 28 after therapy onset. (b) Vessel architecture in tumor edge, tumor center and reference tissue at baseline and day 28. DCE - Ktrans DSC - CBF Vessel architectural imaging in a healthy volunteer. (a–d) Simultaneously acquired gradient-echo (GE) (a) and spin-echo (SE) (b) contrast enhanced relaxation rate images (c) in slow-inflow areas the spin-echo signal peaks earlier than the gradient-echo signal, resulting in a counterclockwise vortex (d). The contrast agent–induced relaxation rates in c and d are scaled relative to their baseline rates and will change with mean transit time. DWI - ADC (c) KM survival curves show prolonged survival for responding subjects compared to nonresponding subjects (relative decrease in voxels with a clockwise vessel vortex direction.) Comparison of the FOVs in standard and SMS DSC MRI. (1) Standard DSC, (2) SMS DSC, and (3) SMS DSC after eliminating the tissues out of standard DSC FOV. B: Labels of automatically generated healthy anatomical regions overlaid on MPRAGE image. Representative GE CBV maps generated from standard (first row) and SMS (second row) DSC images for subjects 1, 2, and 3 (from left to right). Scatter and Bland-Altman plots of GE CBV (SMS vs. standard) Machine Learning based tissue classification for adaptive radiation therapy treatment planning Future Plans/Upcoming Trials “Upsampling” algorithms improves resolution of DCE imaging by incorporating high resolution anatomical scan Preliminary multimodal analysis of vasogenic edema in GBM patients treated with anti-angiogenic therapy suggests distance from T1-Gd a good predictor tumor boundary Phase II clinical trial of Tivozanib . Avastin in combination with daily temozolomide chemotherapy to look at tumor drug delivery Upsampling of BrainWeb T2W images with 5 mm slice thickness. First row: upsampling using NN, spline, and SSIP methods. Second row: upsampling using the proposed method, original HR T2W image, and HR T1W image used for upsampling. DCE-MRI upsampling. Columns 1 to 3: images before and after upsampling, and the original image, showing time points 10 (first row, before contrast arrival) and 100 (second row, after contrast arrival). Columns 4 to 6: parametric maps (ktrans, first row; AUC, second row) from images before and after upsampling and the original image Available MRI modalities used to define features. Tumor perfusion and oxygenation Response to anti-angiogenic therapy for 2 patients. The VE corresponds to the responsive voxels (blue). The non responsive voxels are tumor related (red). Radiotherapy plans for two different patients. CTV1 (blue) and CTV2 (green) are overlaid on the T2 FLAIR image. The dose distributions based on CTV1 and CTV2 are overlaid on the CT image Phase II trial of patient specific tumor vaccination Prediction for4 methods, one patient per panel. The tumor infiltration in red, the VE in blue, prediction inin white.