Download
1 / 29
290 likes | 492 Views
Metrics – Density - Graphs. Chapter 1. Metrics. (SI) Most other nations use the metric system System of measurement based on multiples of ten. B. SI Units. Quantity. Base Unit. Symbol. Length. meter. m. Mass. kilogram. kg. Volume. liter. L. Time . second. s. Temp. Kelvin. K.

E N D
Metrics – Density - Graphs Chapter 1
Metrics • (SI) • Most other nations use the metric system • System of measurement based on multiples of ten.
B. SI Units Quantity Base Unit Symbol Length meter m Mass kilogram kg Volume liter L Time second s Temp Kelvin K
kilo- k 103 102 101 1 deci- d 10-1 centi- c 10-2 milli- m 10-3 B. SI Units Prefix Symbol Factor khdbdcm Earth: Length Lab
To the left or right? A. SI Prefix Conversions 1. Find the difference between the exponents of the two prefixes. 2. Move the decimal that many places.
A. SI Prefix Conversions 0.532 532 m = _______ km khdbdcm
1) 20 cm = ______________ m 2) 0.032 L = ______________ mL 3) 45 kg = ______________ g 4) 805 dm = ______________ km A. SI Prefix Conversions khdbdcm 0.2 32 45,000 0.0805
Prefix Conversions khdbdcm Assume your mass is 55 kg. How many grams do you weigh?
B. Dimensional Analysis • Steps: 1. Identify starting & ending units. 2. Line up conversion factors so units cancel. 3. Multiply all top numbers & divide by each bottom number. 4. Check units & answer.
B. Dimensional Analysis • Lining up conversion factors: = 1 1 L = 1000 ml 1000 ml 1 L
L mL B. Dimensional Analysis • How many milliliters are in 15 liters of Mt. Dew? 1000 mL 1 L 15 L = 15,000 mL
mm cm B. Dimensional Analysis • Your European hairdresser wants to cut your hair 8 cm shorter. How many mm will he be cutting off? 8 cm 10 mm 1 cm = 80 mm
km mm B. Dimensional Analysis 6) How many millimeters long is a 5K (5 km) race? 1000 m 1 km 1000mm 1 m 5 km = 5,000,000 mm
Measuring Volume • Volume - amount of space occupied by an object • Volume of a solid rectangle (V = l x w x h) • 1 mL = 1 cm3 • 1000 mL = _____L • 1 L = _______ cm3 • 1000 cm3 = ______ dm3 1.5 Liters = ______cm3 1.5 Liters = ______dm3 Determine Book’s Volume
Measuring Volume • Odd shape solid • Method: • water displacement • Initial Volume ____ • Final Volume ____ • Object’s Volume ____
Measuring Mass • Mass is a measurement of the quantity of matter in an object.
M V M D= D V Density • Density - mass per unit volume (g/cm3) - (g/mL)
D = g/cm3 or g/mL M = g V = cm3 or mL
WORK: D = M V D = 620 g 753 cm3 M D V D. Density 2) You have a sample with a mass of 620 g & a volume of 753 cm3. Find density. GIVEN: M = 620 g V = 753 cm3 D = ? D = 0.82 g/cm3
M D V D. Density • An object has a volume of 825 cm3 and a density of 13.6 g/cm3. Find its mass. GIVEN: V = 825 cm3 D = 13.6 g/cm3 M = ? WORK: M = DV M = (13.6 g/cm3)(825cm3) M = 11,220 g
WORK: V = M D V = 25 g 0.87 g/mL M D V D. Density 1) A liquid has a density of 0.87 g/mL. What volume is occupied by 25 g of the liquid? GIVEN: D = 0.87 g/mL V = ? M = 25 g V = 28.7 mL
Water • Solid • Liquid • Gas • D = 1 g/mL
Temperature • K = C + 273 • So, on the Kelvin scale, water freezes at 273 K and boils at 373 K. • F = (C × 9/5) + 32
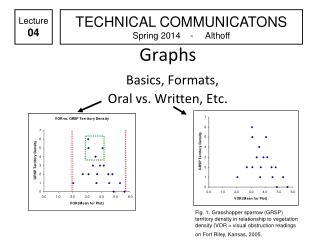
A. Types of Graphs • Line Graph • shows the relationship between 2 variables Dependent Variable Independent Variable
A. Types of Graphs • Bar Graph • shows information collected by counting
A. Types of Graphs • Pie Graph • shows distribution of parts within a whole quantity
Mass (g) Volume (cm3) B. Graphing & Density Slope = ∆Y ∆X