Download
1 / 4
40 likes | 150 Views
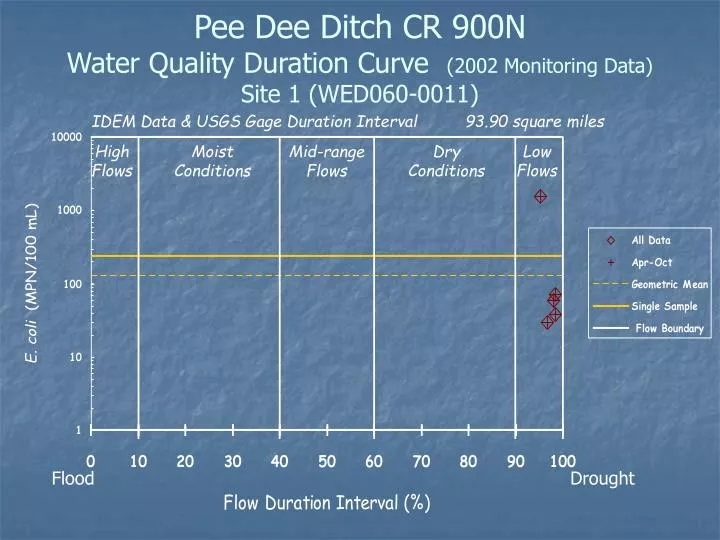
Pee Dee Ditch CR 900N Water Quality Duration Curve (2002 Monitoring Data) Site 1 (WED060-0011). IDEM Data & USGS Gage Duration Interval. 93.90 square miles. High Flows. Low Flows. Moist Conditions. Mid-range Flows. Dry Conditions. Flood. Drought.

E N D
Pee Dee Ditch CR 900NWater Quality Duration Curve (2002 Monitoring Data)Site 1 (WED060-0011) IDEM Data & USGS Gage Duration Interval 93.90 square miles High Flows Low Flows Moist Conditions Mid-range Flows Dry Conditions Flood Drought
Sugar Creek CR 200SWater Quality Duration Curve (2002 Monitoring Data)Site 9 (WED060-0017) IDEM Data & USGS Gage Duration Interval 93.90 square miles High Flows Low Flows Moist Conditions Mid-range Flows Dry Conditions Flood Drought
Little Sugar Creek CR 350NWater Quality Duration Curve (2002 Monitoring Data)Site 11 (WED080-0014) IDEM Data & USGS Gage Duration Interval 93.90 square miles High Flows Moist Conditions Mid-range Flows Dry Conditions Low Flows Flood Drought
Sugar Creek North Street and Schoolhouse RoadWater Quality Duration Curve (2002 Monitoring Data)Site 14 (WED090-0026) IDEM Data & USGS Gage Duration Interval 93.90 square miles High Flows Low Flows Moist Conditions Mid-range Flows Dry Conditions Flood Drought