Download
1 / 1
10 likes | 103 Views
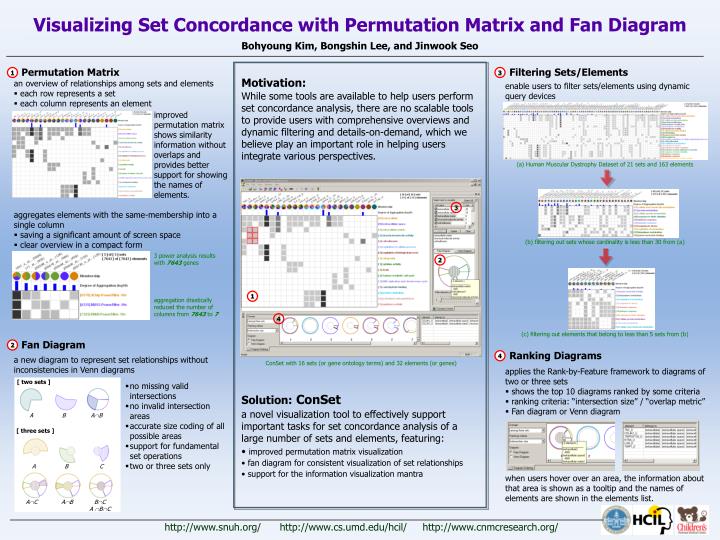
3. 2. 3 power analysis results with 7643 genes. 1. aggregation drastically reduced the number of columns from 7643 to 7. 4. Visualizing Set Concordance with Permutation Matrix and Fan Diagram. Bohyoung Kim, Bongshin Lee, and Jinwook Seo. Permutation Matrix. Filtering Sets/Elements.

E N D
3 2 3 power analysis results with 7643 genes 1 aggregation drastically reduced the number of columns from 7643 to 7 4 Visualizing Set Concordance with Permutation Matrix and Fan Diagram Bohyoung Kim, Bongshin Lee, and Jinwook Seo Permutation Matrix Filtering Sets/Elements 1 3 Motivation: While some tools are available to help users perform set concordance analysis, there are no scalable tools to provide users with comprehensive overviews and dynamic filtering and details-on-demand, which we believe play an important role in helping users integrate various perspectives. • an overview of relationships among sets and elements • each row represents a set • each column represents an element enable users to filter sets/elements using dynamic query devices improved permutation matrix shows similarity information without overlaps and provides better support for showing the names of elements. (a) Human Muscular Dystrophy Dataset of 21 sets and 163 elements • aggregates elements with the same-membership into a single column • saving a significant amount of screen space • clear overview in a compact form (b) filtering out sets whose cardinality is less than 30 from (a) (c) filtering out elements that belong to less than 5 sets from (b) Fan Diagram 2 Ranking Diagrams 4 a new diagram to represent set relationships without inconsistencies in Venn diagrams ConSet with 16 sets (or gene ontology terms) and 32 elements (or genes) • applies the Rank-by-Feature framework to diagrams of two or three sets • shows the top 10 diagrams ranked by some criteria • ranking criteria: “intersection size” / “overlap metric” • Fan diagram or Venn diagram [ two sets ] • no missing valid intersections • no invalid intersection areas • accurate size coding of all possible areas • support for fundamental set operations • two or three sets only • Solution: ConSet • a novel visualization tool to effectively support important tasks for set concordance analysis of a large number of sets and elements, featuring: • improved permutation matrix visualization • fan diagram for consistent visualization of set relationships • support for the information visualization mantra A B AB [ three sets ] A B C when users hover over an area, the information about that area is shown as a tooltip and the names of elements are shown in the elements list. AC AB BC A BC http://www.snuh.org/ http://www.cs.umd.edu/hcil/ http://www.cnmcresearch.org/