1 / 1

Petroleum System Events Chart

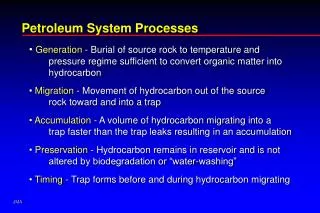
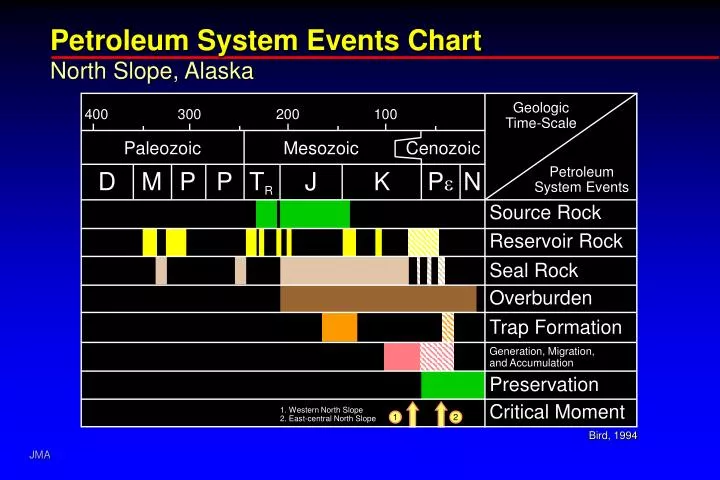
1. 2. Petroleum System Events Chart. North Slope, Alaska. Geologic Time-Scale. 400. 300. 200. 100. Paleozoic. Mesozoic. Cenozoic. Petroleum System Events. D. M. P. P. T R. J. K. P e. N. Source Rock. Reservoir Rock. Seal Rock. Overburden. Trap Formation.

lev-stuart
Download Presentation

Petroleum System Events Chart

An Image/Link below is provided (as is) to download presentation Download Policy: Content on the Website is provided to you AS IS for your information and personal use and may not be sold / licensed / shared on other websites without getting consent from its author. Content is provided to you AS IS for your information and personal use only. Download presentation by click this link. While downloading, if for some reason you are not able to download a presentation, the publisher may have deleted the file from their server. During download, if you can't get a presentation, the file might be deleted by the publisher.

E N D

Presentation Transcript


  1. 1 2 Petroleum System Events Chart North Slope, Alaska Geologic Time-Scale 400 300 200 100 Paleozoic Mesozoic Cenozoic Petroleum System Events D M P P TR J K Pe N Source Rock Reservoir Rock Seal Rock Overburden Trap Formation Generation, Migration, and Accumulation Preservation Critical Moment 1. Western North Slope 2. East-central North Slope Bird, 1994

More Related