Download
1 / 86
860 likes | 865 Views
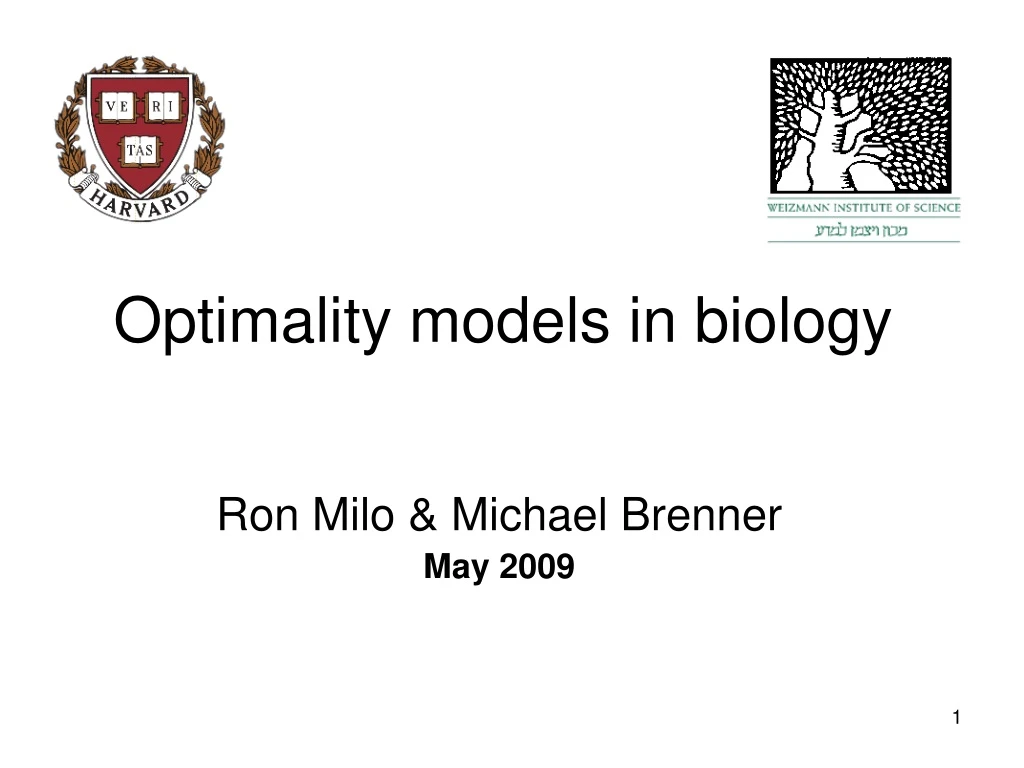
Optimality models in biology. Ron Milo & Michael Brenner May 2009. Why are biological systems built the way they are?. In biology we usually ask (and answer) questions about: what are the processes? how are they functioning? who are the molecular players?

E N D
Optimality models in biology Ron Milo & Michael Brenner May 2009
Why are biological systems built the way they are? • In biology we usually ask (and answer) questions about: • what are the processes? • how are they functioning? • who are the molecular players? • when and where are they expressed? • Can we approach Why questions?
Optimality models analysis is useful in a wide range of biological fields We learn through case studies: • Foraging strategy • Gene expression • Spores shapes • Metabolism network http://openwetware.org/wiki/Optimality_In_Biology Google: “optimality in biology”
Principles of minimality and maximality explain many physical phenomena • At the heart of many fields of physics • “Minimal action” governs classical mechanics (Lagrangian formulation) • Maximal Entropy in thermodynamics • Geometrical optics can be derived from Fermat’s principle for minimal time • Area minimization in soap bubbles due to surface tension
Strong predictive power: geometrical optics laws are derived from Fermat’s principle Fermat’s principle: A light ray traveling from one fixed point to another will follow a path such that the time required is an extreme point – either a maximum or a minimum. Rules for Reflection and Refraction “Sand” “Water”
Optimization model example: Which rectangle has maximum area for given perimeter?
Evolutionary optimization model construction • Ask an explicit biological question • A range or space of alternatives is defined • An assumption on what is being maximized, fitness proxy • Convert alternatives to fitness payoffs, includes constraints and tradeoffs • Find optimal solution, test against observations • Suggest experiments and make falsifiable predictions
Evolutionary optimization model construction • Ask an explicit biological question • “Why is the sex ratio often unity?” • The question is assumed to have an adaptive answer 2. A range or space of alternatives is defined • Any ratio of males to females • An assumption on what is being maximized, fitness proxy • Expected lifetime number of surviving offspring • For an allele can include same allele carried in relatives • Indirect measures often used: minimal energy, maximal food etc. • Convert alternatives to fitness payoffs, includes constraints and tradeoffs • “for fixed resources more sons means less daughters” • Find optimal solution, test against observations • Suggest experiments and make falsifiable predictions
Evolutionary optimization model construction • Ask an explicit biological question • A range or space of alternatives is defined • An assumption on what is being maximized, fitness proxy • Convert alternatives to fitness payoffs, includes constraints and tradeoffs • Find optimal solution, test against observations • Suggest experiments and make falsifiable predictions This is the type of “why” answers - not a theological sense
Optimality analysis helps to sharpen our understanding • “Optimization models help us to test our insight into the biological constraints that influence the outcome of evolution. They serve to improve our understanding about adaptations, rather than to demonstrate that natural selection produces optimal solutions. “ Parker & Maynard-Smith, Nature (1990)
Optimality analysis helps to sharpen our understanding – even though evolution is a tinkerer • “It [natural selection] works like a tinkerer - a tinkerer who does not know exactly what he is going to produce but uses whatever he finds around him whether it be pieces of string, fragments of wood, or old cardboards; in short it works like a tinkerer who uses everything at his disposal to produce some kind of workable object. “ Jacob, Science (1977) See also: Alon, Biological networks - the tinkerer as an engineer, Science (2003)
Clarification – not everything is optimal • Not everything in biology is claimed to be optimal – optimality is a model assumption not a law of nature • Phylogeny and development has major effects - frozen accidents • Random drift is often a dominant force (alleles can become fixed in a population in spite of natural selection) • Drift is especially pronounced in small populations • If only small advantage for “optimal” then the multiplicity of “good enough” will prevail • Evolutionary selective pressure can appear only in some periods of time
Foraging strategy of honeybees – why are honeycrops filled only partially? Question (1) A full crop is approximately 55 flower visits but often bees carry much less to the hive Maximization of rate of energy extraction predicts incomplete loads should only be gathered if patch is depleting Schmid-Hempel, Kacelnik & Houston Behav. Ecol. Sociobiol. (1985)
Foraging strategy of honeybees – why are honeycrops filled only partially? Hive N flowers visited Hive time Slopes depends on load – metabolic flight loss Alternatives (2) As a function of the number of flower visits (N): measured Gross energetic gain (G) measuredTotal energetic expenditure or loss (L) measuredTotal time (T) per foraging cycle Constraints and conversion (4) Schmid-Hempel, Kacelnik & Houston Behav. Ecol. Sociobiol. (1985)
Optimality models can differentiate among fitness criteria Gross energetic gain (G) Total energetic expenditure or loss (L) Total time (T) per foraging cycle optimization criterion: - net energy gain per unit time =(G - L) T Fitness (3) Schmid-Hempel, Kacelnik & Houston Behav. Ecol. Sociobiol. (1985)
Optimality models can differentiate among fitness criteria • Gross energetic gain (G) • Total energetic expenditure or loss (L) • Total time (T) per foraging cycle • optimization criterion: • - net energy gain per unit time =(G - L) • T • net energy gain per unit energy expended = • (G - L) • L Fitness (3) Schmid-Hempel, Kacelnik & Houston Behav. Ecol. Sociobiol. (1985)
Optimality models can differentiate among fitness criteria • Gross energetic gain (G) • Total energetic expenditure or loss (L) • Total time (T) per foraging cycle • optimization criterion: • - net energy gain per unit time =(G - L) • T • net energy gain per unit energy expended = • (G - L) • L Fitness (3) Test with observations (5) Schmid-Hempel, Kacelnik & Houston Behav. Ecol. Sociobiol. (1985)
Optimality models can differentiate among fitness criteria • Gross energetic gain (G) • Total energetic expenditure or loss (L) • Total time (T) per foraging cycle • optimization criterion: • - net energy gain per unit time =(G - L) • T • net energy gain per unit energy expended = • (G - L) • L • A worker's condition deteriorates as a function of the amount of flight performed Prediction (6) Schmid-Hempel, Kacelnik & Houston Behav. Ecol. Sociobiol. (1985)
What can we gain from an optimality model? • Testing understanding of constraints and tradeoffs • Testing understanding of fitness function • Suggestions for new experiments and quantitative questions • …
Interpreting an optimality model • “The final step in the optimality approach is to test the predictions against the observations. If they fit, then the model may really reflect the forces that have molded the adaptation. If they do not, we may have misidentified the strategy set, or the optimization criterion, or the payoffs; or the phenomenon we have chosen may not any longer be adaptive…“ Parker & Maynard-Smith, Nature (1990)
Interpreting an optimality model • “…by reworking our assumptions, we modify our model and revise and retest the predictions. This has been criticized as being an iterative procedure leading inevitably to a fit. But this is how science works; theories can only be discarded when they are disproven or found to be unrealistic.” Parker & Maynard-Smith, Nature (1990)
Why are optimality models at the molecular level maturing now? • After answering the who and how questions • Requires quantitative tools and information recently becoming available in biology • We begin to design and build biological systems
The number you need, with reference in one minute BioNumbers – Useful biological numbers database Wiki-like, users edit and comment Over 3500 properties & 5000 users/month www.BioNumbers.org
Warm-up: trying to beat nature at design How to transform 5 carbon sugars into 6 carbon sugars? (e.g from cell wall or nucleic acids glycolysis) 6 x x 5
The pentose phosphate pathway defined as a game • Goal: • Turn 6 Pentoses into 5 Hexoses • Rules: • Transfer 2-3 carbons between two molecules • Never leave a molecule with 1-2 carbons • Optimization function: • Minimize the number of steps (simplicity) ? Among equally long solutions prefer the one using the least number of carbons in molecules E. Meléndez-Hevia et al. (Journal of theoretical Biology 1994)
Solution to Pentose Phosphate game in 7 steps • Corresponds to natural pathway • Doesn't explain why the rules exist • Supports the idea of simplicity
Are there simplifying principles to the structure of the central carbohydrate metabolism network? PPP
Cost Benefit methodology Benefits B and costs C of adopting strategy x. e.g.: a foraging lapwing: B(x) is the calorific value of prey items obtained after each move of distance x C(x) is the energetic cost of moving distance x. Indirect fitness function: net energy gain per move, E(x) = B(x) - C(x). X
Cost-benefit analysis case study: Optimality and evolutionary tuning of the expression level of a protein Study by Erez Dekel Uri Alon’s group Weizmann Institute of Science
Different proteins are found in the cell at different numbers What determines the expressionlevel of a protein?
Evolutionary theory suggests maximization of a fitness function
Fitness functions have seldom been experimentally measured • Can we measure fitness function? • Can we find a deterministic theory to predict an optimum in a given environment? • (why 60000 copies per cell?)
lac operon of E. coli is an ideal model system • Well studied, detailed knowledge of biochemical parameters. • Excellent tools: • IPTG: induces the lac operon, but cells cannot grow on it • ONPG: measures protein activity • The fitness function in exponential growing bacteria can be the growth rate.
Model system: The lac operon ofE. coli, a well-characterized gene system Lactose Y Z Z Z Z Growth lac Z Y A
An experimental study of fitness and optimization • Measure the cost and benefit of the lac proteins in wild-type E. coli • Find the predicted optimal expression as a function of the environment • Perform laboratory evolution experiments in different environments and monitorthe evolution of the protein expression level
Growth rate is sum of costand benefit of protein production cost benefit Cost: reduction in growth due to burden of producing protein Benefit: increase in growth rate due to action of protein (lactose utilization).
Cost function can be measured byproducing proteins without benefit Use inducer IPTG to produce LacZ, this inducer cannot be metabolized, hence no benefit g=g0 –C(Z) +B(Z) Decoupling cost and benefit measuring all parameters (no free parameters)
Cost of full LacZ production is about 4.4%(i.e. grows 4.4% slower) Cost M9+glycerol, 37C Expression See also: Koch Mol. Evol. 1983; Lenski Mol. Biol. Evl. 1989; Dong, 1995
Benefit is measured by growth at variouslevels of lactose with full lac expression g=g0 –C(Zmax) + B(Zmax,L) Constant cost Benefit depends on concentration of sugar lactose
Benefit of full LacZ productionat saturating lactose is 15% 15% h(ZWT) Benefit B(Z,L)=B0[ZLin] Lactose level Red curve: model of lactose transport with experimentally measured parameters (Models: Kremling, 2001; Mackey, 2004)
Balance of cost and benefit predictsoptimal expression level The calibrated fitness landscape Optimum level at low lactose islower than wild-type
Optimal expression level is higher at high lactose concentrations
Wild-type protein level is predicted tobe optimal at lactose level of 0.6mM
Optimal LacZ level (relative to wild-type) Predicted optimal protein level duringevolution in a constant lactose environment
Day 2 Day 3 Day 1 ...... Experimental evolution using serial dilution Dilution rate 1:100 Number of generations per day is log2100=6.6 See also: Lenski PNAS 2003; Palsson Nature 2002
Evolutionary experiment on seven lactose levels in parallel • Minimal medium + IPTG and 0.1% glycerol • Lactose concentrations: 0, 0.1, 0.2, 0.5, 1, 2, 5mM • LacZ activity measured every 20 generations(ONPG assay) • Protein level measured by quantitative electrophoresis
Will LacZ expression level evolve towards optimal predicted level?
2 LacZ activity and protein level adapts to the environment within several hundred generations Wild-type levels do not change at 0.5mM lactose Dekel & Alon, Nature (2005)