Download
1 / 22
220 likes | 443 Views
BIOMASS ENERGY in OREGON 2009 Alex Sifford. Feedstocks. Forest residues Mill residuals Urban wood waste Ag wastes MSW, manure. FOREST RESIDUES. Tree tops, limbs, shatter, rot & cull Typically piled & burned More with clear cuts v. thinning 50% Moisture Costs to process & transport

E N D
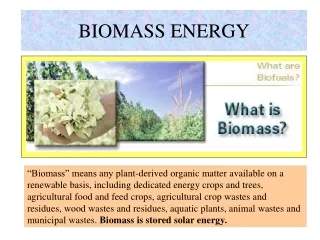
Feedstocks • Forest residues • Mill residuals • Urban wood waste • Ag wastes • MSW, manure
FOREST RESIDUES • Tree tops, limbs, shatter, rot & cull • Typically piled & burned • More with clear cuts v. thinning • 50% Moisture • Costs to process & transport • Energy goal is hog fuel
MILL RESIDUES • Wood scraps “hogged” into fuel • Less created over time: • 20% in 1968 • v. • 1% in 1985 • Source ODOE, 1993
URBAN WOOD WASTE • Construction debris, packaging, pallets • Cost savings from disposal & green building drives supply • Fiber for particleboard pays more • Energy demand is hog fuel
Conversion Technology Process Biomass Feedstocks Energy or Fuel Produced Direct Combustion Thermochemical wood heat agricultural waste steam municipal solid waste power residential fuels low or medium - Btu pro ducer gas Gasification Thermochemical wood agricultural waste municipal solid waste Pyrolysis Thermochemical wood synthetic fuel oil (biocrude) agricultural waste municipal solid waste charcoal Anaerobic Digestion Biochemical animal manure agricultural waste medium Btu gas (methane) (anaerobic) landfills wastewater Ethanol Production Biochemical sugar or starch crops ethanol (aerobic) wood waste pulp sludge grass straw Biodiesel Production Chemical rapeseed biodiesel soy beans waste v egetable oil animal fats Methanol Production Thermochemical wood methanol agricultural waste municipal solid waste BIOENERGY MATRIX
TRANSPORTATION ♦ $30-40/ Bone Dry Ton ♦ Translates to ~ $30-40/ MWh ♦ Fuel cost not cheap
OREGON USE • From cabins to homes to businesses • Residential Stoves • Cordwood, Pellets • Commercial furnaces • Cordwood, Pellets • Industrial • Hog fuel
OREGON USE Supplied 75 trillion Btu of useful energy in 2004, mostly industrial use & home heating Supplied ~ 1,130 million kilowatt-hours of electricity in 2004. Biomass supplies ~ 9 percent of all Industrial energy consumed in the state Source: Oregon Department of Energy
Industrial/Commercial Bioenergy • 6 pulp mills in Oregon operate chemical recovery boilers. • ~ 35 trillion Btu pulping liquor for industrial processes in 2004 • 2 pulp mills cogenerate steam and power • ~ 206 million kilowatt-hours of electric energy in 2004.
Industrial/Commercial Bioenergy • 49 industrial sites supply process energy • 10 of those sites generated 942 million kilowatt-hours in 2004 • Consumed 1.6 million bone dry tons of biomass fuel (27 trillion Btu)
Residential Bioenergy • Firewood plus scrap wood are sources. • 22% of Oregon households as main or back-up heating • ~ 490,000 cords of firewood were consumed in 2004 • 3 Oregon pellet mfgers & one of briquettes. • They made ~ 320,000 tons in 2007
Municipal Solid Waste Combustion • 1 MSW burner at Brooks since 1986 • Owned by Covanta Marion, Inc. • 2 furnace capacity to burn 550 tons/day • Solid waste = 1.7 trillion Btu • Power generated 99.2 million kWh
BIOGAS Wastewater TreatmentAnaerobic digesters are part of 28 large wastewater treatment plants in Oregon. • Digester gas produced an energy value of about 0.8 trillion Btu for boiler fuel • 9 WWTPs use digester gas as fuel to generate electricity. The plants generated about 26 million kilowatt-hours in 2004. Landfill Gas • 2 landfills generate power: Short Mountain in Lane County & Coffin Butte in Benton County generated about 36.5 million kilowatt-hours of electric energy in 2004.Ash Grove Cement Company uses gas from the now-closed St. Johns Landfill in Portland to heat its lime kilns River Bend Landfill in Yamhill County burns landfill gas to evaporate leachate. These facilities produced about 0.45 trillion Btu of energy in 2004.
BIOGAS • Tillamook Digester in 2003 • ~ 4000 dairy cows produce ~ 1.3 million kWh • PGE built a digester at CalGon Farms dairy • ~ 400 dairy cows produce 236,000 kWh
TREES FOR FUEL • Poplars • Switchgrass in South • Fast Growth • Fiber > Fuel
ENVIRONMENT • Plants regrown = net 0 CO2 • State air, solid waste & water quality permits • County building permits
Additional Info: ODOE oregon.gov/ENERGY Biogas www.potb.org/methane-energy.htm