Download
1 / 40
400 likes | 513 Views
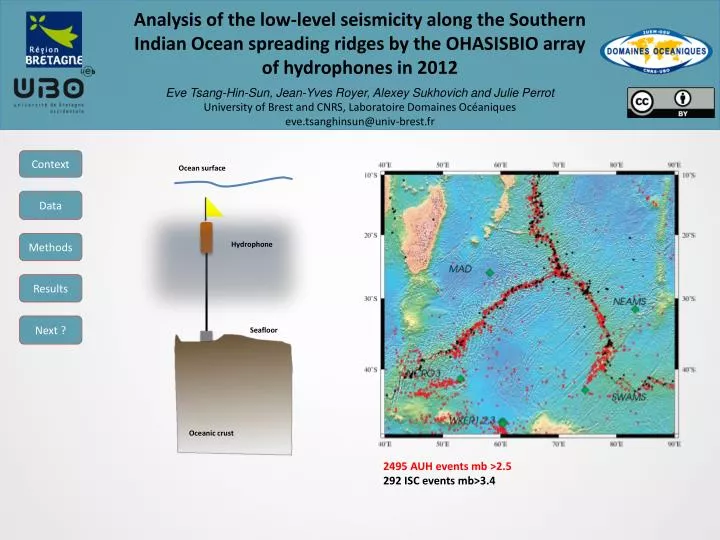
Analysis of the low-level seismicity along the Southern Indian Ocean spreading ridges by the OHASISBIO array of hydrophones in 2012 Eve Tsang- Hin -Sun, Jean-Yves Royer, Alexey Sukhovich and Julie Perrot University of Brest and CNRS, Laboratoire Domaines Océaniques

E N D
Analysis of the low-level seismicity along the Southern Indian Ocean spreading ridges by the OHASISBIO array of hydrophones in 2012 Eve Tsang-Hin-Sun, Jean-Yves Royer, AlexeySukhovich and Julie Perrot University of Brest and CNRS, LaboratoireDomainesOcéaniques eve.tsanghinsun@univ-brest.fr Context Ocean surface Data Methods Hydrophone Results Next ? Seafloor Oceanic crust 2495 AUH events mb >2.5 292 ISC events mb>3.4
Analysis of the low-level seismicity along the Southern Indian Ocean spreading ridges by the OHASISBIO array of hydrophones in 2012 Eve Tsang-Hin-Sun, Jean-Yves Royer, Alexey Sukhovich and Julie Perrot University of Brest and CNRS, Laboratoire Domaines Océaniques X Context • The Indian Ocean is characterized by three mid-oceanic ridges with contrasted spreading rate: • The Southwest Indian Ridge (SWIR) is the slowest of the three with a full rate of ~15 mm/yr and a complex morphology, mainly governed by tectonic processes with little magma supply. • Seismicity is evenly distributed along ridge segments and transform faults. In 2012, some ridge segments seemed almost inactive, especially south to the triple junction • The Central Indian Ridge (CIR) ridge has a slow to intermediate spreading rate of 35 mm/yr . • Seismicity is also evenly distributed along ridge segments and transform faults. • The Southeast Indian Ridge (SEIR) is the fastest of the three with a spreading rate of 60 mm/yr. • Seismicity is mainly located on transform faults except for one very active ridge segment. • Due to their remote location relative to the seismological networks, the low-magnitude activity of these spreading ridges remains poorly known. Data Seismicityreported in 2012 by land-basedcatalogs Methods Results CIR Next ? SWIR SEIR 1/3
Analysis of the low-levelseismicityalong the SouthernIndianOceanspreadingridges by the OHASISBIO array of hydrophones in 2012 Eve Tsang-Hin-Sun, Jean-Yves Royer, Alexey Sukhovich and Julie Perrot University of Brest and CNRS, Laboratoire Domaines Océaniques X • 2012 seismic catalogs • ISC bulletin (red points) reports 183 events • Global CMT catalog reports only 19 large earthquakes • Seismicity is mainly located along the three spreading ridges. • Events are mainly located on transform faults along the SEIR and the CIR. • A segment of the SEIR near 29°S shows an unusual activity. • Seismic gaps appear along some SWIR segments. CIR SWIR SEIR
Analysis of the low-level seismicity along the Southern Indian Ocean spreading ridges by the OHASISBIO array of hydrophones in 2012 Eve Tsang-Hin-Sun, Jean-Yves Royer, Alexey Sukhovich and Julie Perrot University of Brest and CNRS, Laboratoire Domaines Océaniques X Context The hydroacoustic approach Submarine earthquakes produce seismic wave that propagate through the oceanic crust and convert to acoustic T-waves at the seafloor-ocean interface. These acoustic phases propagate laterally and eventually penetrate the SOFAR channel, a low sound velocity layer in the water column. The SOFAR channel acts as wave guide and carries the T-waves energy over very long distances (> 1000 km) with little attenuation. Hence hydrophones can detect smaller (mb > 2.5) earthquakes than land-based stations. Up to several thousands of km Sound speed Ocean surface Data 500-1300 m Methods SOFAR channel Results T-wave Next ? Ocean Depth Focus P and S waves Oceanic crust 2/3
Analysis of the low-levelseismicityalong the SouthernIndianOceanspreadingridges by the OHASISBIO array of hydrophones in 2012 Eve Tsang-Hin-Sun, Jean-Yves Royer, Alexey Sukhovich and Julie Perrot University of Brest and CNRS, Laboratoire Domaines Océaniques X Up to several 1000 of km Ocean surface Sound speed 500-1300 m SOFAR channel T-wave Ocean bottom Depth Focus P and S waves Deployment of a hydrophone in the SOFAR (Sound Fixing And Ranging) channel. The hydrophone is moored in the SOFAR channel axis. The line is composed of an expandable weight, an acoustic release, an adjustable line and a buoy hosting the instrument. The purpose of the buoy is to keep the line stretched and to recover it when released from the weight. Oceanic crust
Analysis of the low-level seismicity along the Southern Indian Ocean spreading ridges by the OHASISBIO array of hydrophones in 2012 Eve Tsang-Hin-Sun, Jean-Yves Royer, Alexey Sukhovich and Julie Perrot University of Brest and CNRS, Laboratoire Domaines Océaniques X Context • The OHASISBIO array • The array is composed of 7 autonomous hydrophones deployed at 5 sites encompassing large sections of the three Indian spreading ridges. • The long-term deployment of the array takes advantage of the yearly voyage of RV Marion Dufresneto the French southern islands. • This study is based on data collected between February 2012 and February 2013. • Our analysis presents the low-level seismicity recorded along the three MOR and discussed the nature of some clusters of events. Data Methods Results Next ? 3/3
Analysis of the low-level seismicity along the Southern Indian Ocean spreading ridges by the OHASISBIO array of hydrophones in 2012 Eve Tsang-Hin-Sun, Jean-Yves Royer, AlexeySukhovich and Julie Perrot University of Brest and CNRS, LaboratoireDomainesOcéaniques X The OHASISBIO array : 5 sites 7 instruments The monitored area is about 2000 x 2000 km2 1000 km
Analysis of the low-levelseismicityalong the SouthernIndianOceanspreadingridges by the OHASISBIO array of hydrophones in 2012 Eve Tsang-Hin-Sun, Jean-Yves Royer, Alexey Sukhovich and Julie Perrot University of Brest and CNRS, Laboratoire Domaines Océaniques X Sketch of the hydrophone instrument. The housing is a solid titanium tube containing batteries, electronic board and data storage devices. The sensor itself is attached to the buoy frame. Detailed view of the electronic board and sensor.
Analysis of the low-levelseismicityalong the SouthernIndianOceanspreadingridges by the OHASISBIO array of hydrophones in 2012 Eve Tsang-Hin-Sun, Jean-Yves Royer, Alexey Sukhovich and Julie Perrot University of Brest and CNRS, Laboratoire Domaines Océaniques X • Hydroacoustic data • Covered period: 4 Feb. 2012 – 16 Feb. 2013 • Continuous • Sampling: 240 Hz • 3 bytes dynamic (224 range) • Clock drift in the order of 10-8s/s • Data analysis • Data from the 7 hydrophones are jointly visualized using the Seasick package from NOAA/PMEL • Arrival times are hand-picked on spectrograms (fig. 1) • Source location and origin times are estimated with a nonlinear least squares methods using regional sound speed models. • Location errors for latitude, longitude and origin time are estimated through a bootstrap approach based on Monte Carlo simulation techniques. • Results • A total of 7776 acoustic events were located in the whole Indian Ocean Basin. • Events are more accurately located inside the array (40°S- 20°S and 52°E - 80°E ) than outside. • Fig. 2 displays the uncertainties in the location and time origin for the whole catalog and study area, based on events detected by 4 or more hydrophones. Context Data Methods Results Next ? 2) 1)
Analysis of the low-levelseismicityalong the SouthernIndianOceanspreadingridges by the OHASISBIO array of hydrophones in 2012 Eve Tsang-Hin-Sun, Jean-Yves Royer, Alexey Sukhovich and Julie Perrot University of Brest and CNRS, Laboratoire Domaines Océaniques X Example of time arrival picking for an earthquake that occurred along the SWIR on 8 October 2012 at 10h26. As the signal is scrolling on the screen, the analyst identifies signals on each hydrophone (here all the 7 instruments) and manually picks the maximum of energy on each spectrogram. The main difficulty is to associate events originating from the same source. The advantage of using a spectral representation is that it provides information on the nature of the source, making it easier to distinguish different types of signal. WKER1 WKER3 NEAMS SWAMS MAD NCRO3 WKER2 Time Frequency 0-50 Hz
Analysis of the low-levelseismicityalong the SouthernIndianOceanspreadingridges by the OHASISBIO array of hydrophones in 2012 Eve Tsang-Hin-Sun, Jean-Yves Royer, Alexey Sukhovich and Julie Perrot University of Brest and CNRS, Laboratoire Domaines Océaniques X • Distribution of the uncertainties in latitude, longitude and origin time • for the whole catalog (blue) and • for the study area (red dots in green square) inside the hydrophone array • Most events are relatively well located, with uncertainties less than 2 s on the origin time and 2.7 km (0.025°) in latitude or longitude. • The map shows all the events located with 4 hydrophones and more.
Analysis of the low-levelseismicityalong the SouthernIndianOceanspreadingridges by the OHASISBIO array of hydrophones in 2012 Eve Tsang-Hin-Sun, Jean-Yves Royer, Alexey Sukhovich and Julie Perrot University of Brest and CNRS, Laboratoire Domaines Océaniques X • Source Level and completeness • As for the magnitude of earthquakes, a source level of completeness (SLc), similar to the Mc for earthquakes, can be derived from fitting a Gutenberg-Richter law-like adapted to acoustic events: • Nis the number of events with a source level greater or equal to SL; • a is a constant dependent on the total number of events and is related to the seismic activity; • b is analog to the b-value of the Gutenberg-Richter law and is the slope of the distribution. • The resulting SLc = 230 db (with 1100 events). • Data with SL>256 were excluded from the regression due to the clipping of the sensors for large events. • The Gutenberg-Richter distribution from the ISC catalog for the year 2012 yields Mc=3.8 (100 events) • Extrapolating the latter with slopes b = 1.0 and b = 1.8, we find that the SLccorresponds to a magnitude of completeness of Mc = 3.1 +/- 0.25. • For our analysis of the seismicity along the three ridges, only events with SL >= SLcwere considered. Context Data AUH Methods Results Next ? ISC 1/3
Analysis of the low-levelseismicityalong the SouthernIndianOceanspreadingridges by the OHASISBIO array of hydrophones in 2012 Eve Tsang-Hin-Sun, Jean-Yves Royer, Alexey Sukhovich and Julie Perrot University of Brest and CNRS, Laboratoire Domaines Océaniques X Cumulative number of events from the OHASISBIO AUH catalog as a function of source level (SL). The SLc is defined as the minimum SL where the distribution follows a linear relationship. Here the SLc is ~230 db, which corresponds to ~1100 events. b) Cumulative number of events for the ISC bulletin of 2012. The b-value is 1.8. Extrapolating the result from the AUH catalog and assuming a slope b = 1 and b = 1.8 yields to an estimated magnitude of completeness of 3.1 +/- 0.25.
Analysis of the low-levelseismicityalong the SouthernIndianOceanspreadingridges by the OHASISBIO array of hydrophones in 2012 Eve Tsang-Hin-Sun, Jean-Yves Royer, Alexey Sukhovich and Julie Perrot University of Brest and CNRS, Laboratoire Domaines Océaniques X Identification of clusters Clusters of events were identified using 2 consecutive single-link cluster (SLC) analyses. The method is based on a nearest neighbor grid search and links pairwise elements regarding to the shortest distance. The result of an SLC is best displayed in a dendrogram. First we extracted all events that were linked with an inter-event distance of 20 km. A cluster is defined if it contains more than 10 events. Space-clustering analysis yields to 26 clusters. Second, among each subset of events, we search for events linked by an inter-event arrival time up to 3 days. With the same criterion on the minimum number of events we found 6 clusters (table). For analyzing the regional seismicity, the catalog was declustered, in order to look at the sporadic seismic activity, which reflects the long term patterns of the seafloor spreading. Context Data Methods Results Next ? C6 C7 Clusters at 20 km C2 C1 C3 2/3 C4
Analysis of the low-levelseismicityalong the SouthernIndianOceanspreadingridges by the OHASISBIO array of hydrophones in 2012 Eve Tsang-Hin-Sun, Jean-Yves Royer, Alexey Sukhovich and Julie Perrot University of Brest and CNRS, Laboratoire Domaines Océaniques X • Seismicity distribution and cluster analysis • Earthquakes sequences can be classified into 2 main types of clusters, related to the tectonic settings: • Earthquake swarms, where magnitudes are roughly equivalent for all events and none of them can be described as a possible mainshock. • A large earthquake followed by smaller aftershocks and/or preceded by foreshocks may reflect a predominantly tectonic origin. Such cluster is often associated with slip on transform fault. For these clusters, the cumulative number of aftershocks generally follows a modified Omori law (MOL): • Where K, cand pare empirically estimated constant. The parameter pdescribes the decay rate of events following the mainshock and indicates the stress state of the region. Thep-value generally ranges between 0.6 and 2.5 in continental domain but seems to be higher for oceanic ridges. • The seismicity distribution along the three spreading ridges were computed for both AUH and ISC catalogs. We computed the number of events along the axis in windows of 20 km width. Distances are computed from the triple junction. The resulting distribution was then smoothed with a Gaussian filter to account for location uncertainties. To examine the similarity between the ISC and the AUH profiles, correlation has been examined through the Spearman rank correlation coefficient : • Where Diis the difference of ranksifrom both data sets andnthe number of samples. This correlation coefficient is a good tool tom compare similar trend in a non linear distribution. Context Data Methods Results Next ? 3/3
Analysis of the low-levelseismicityalong the SouthernIndianOceanspreadingridges by the OHASISBIO array of hydrophones in 2012 Eve Tsang-Hin-Sun, Jean-Yves Royer, Alexey Sukhovich and Julie Perrot University of Brest and CNRS, Laboratoire Domaines Océaniques X Decay parameters for each cluster (using Matlab® toolbox Z-MAP developed by the ETH Zurich)
Analysis of the low-levelseismicityalong the SouthernIndianOceanspreadingridges by the OHASISBIO array of hydrophones in 2012 Eve Tsang-Hin-Sun, Jean-Yves Royer, Alexey Sukhovich and Julie Perrot University of Brest and CNRS, Laboratoire Domaines Océaniques X Context Spatio-temporal distribution of the seismicity Data Methods Results Next ? SEIR SWIR CIR • Different time-space behaviors of the seismicity : • High time and spatial clustering on the SEIR, all along the ridge. It appears that zones of time and space clustering are active all year long; • No clustering on the SWIR on the first 1000 km, then spatial clustering but few time clustering; • No specific time clustering along the CIR and a weak trend for spatial clustering 1/5
Analysis of the low-levelseismicityalong the SouthernIndianOceanspreadingridges by the OHASISBIO array of hydrophones in 2012 Eve Tsang-Hin-Sun, Jean-Yves Royer, Alexey Sukhovich and Julie Perrot University of Brest and CNRS, Laboratoire Domaines Océaniques X Spatio-temporal distribution of the seismicity along the SEIR.
Analysis of the low-levelseismicityalong the SouthernIndianOceanspreadingridges by the OHASISBIO array of hydrophones in 2012 Eve Tsang-Hin-Sun, Jean-Yves Royer, Alexey Sukhovich and Julie Perrot University of Brest and CNRS, Laboratoire Domaines Océaniques X Spatio-temporal distribution of the seismicity along the SWIR.
Analysis of the low-levelseismicityalong the SouthernIndianOceanspreadingridges by the OHASISBIO array of hydrophones in 2012 Eve Tsang-Hin-Sun, Jean-Yves Royer, Alexey Sukhovich and Julie Perrot University of Brest and CNRS, Laboratoire Domaines Océaniques X Spatio-temporal distribution of the seismicity along the CIR.
Analysis of the low-levelseismicityalong the SouthernIndianOceanspreadingridges by the OHASISBIO array of hydrophones in 2012 Eve Tsang-Hin-Sun, Jean-Yves Royer, Alexey Sukhovich and Julie Perrot University of Brest and CNRS, Laboratoire Domaines Océaniques X Context Background seismicity The background seismicity is different for each spreading ridge. Whereas the intermediate SEIR and slow CIR exhibit similar behavior on the short and long term seismicity, the ultra-slow SWIR shows more variability in time. In the space domain, events cluster in the vicinity of transform faults along the two fastest MOR and for the SEIR in the vicinity of the St-Paul and Amsterdam hotspot. Along the SWIR, events are more scattered and rather associated with abyssal hills faulting activity. Clusters Among the 6 clusters, only two can be classified as shock/aftershocks sequences. Despite a high uncertainty level, results suggest that most of the rupture processes are complex and certainly mix tectonic and magmatic events. 1342 events detected by more than 4 AUH 328 events detected by 3 AUH 342 clustered events 19 Global CMT solutions Data Methods Results Next ? C6 C7 C2 C1 C3 2/5 C4
Analysis of the low-levelseismicityalong the SouthernIndianOceanspreadingridges by the OHASISBIO array of hydrophones in 2012 Eve Tsang-Hin-Sun, Jean-Yves Royer, Alexey Sukhovich and Julie Perrot University of Brest and CNRS, Laboratoire Domaines Océaniques X Context Seismicity along the SEIR Theseismicity is relatively homogeneous at a large wavelength but does exhibit clear variability at a segment scale. Peaks of activity appear at transform faults and in the vicinity of the S/A hotspot reflecting little thermal influence of the hotspot. The “acoustic” seismicity in one year is similar to the 40 year “teleseismic” seismicity with Spearman rank correlation coefficient 0.6 for unclustered data and 0.7 for declustered data. The seismicity recorded on land over 40 years is equally represented by the seismicity recorded in one year by autonomous hydrophones. The SEIR seismicity is dominated by the transform fault activity and most of the segments appears as seismic gaps, except for one at 29˚S where 2 large clusters occurred. Data C6 C7 Methods C2 Results Next ? C3 C4 3/5
Analysis of the low-levelseismicityalong the SouthernIndianOceanspreadingridges by the OHASISBIO array of hydrophones in 2012 Eve Tsang-Hin-Sun, Jean-Yves Royer, Alexey Sukhovich and Julie Perrot University of Brest and CNRS, Laboratoire Domaines Océaniques X • Close-up on the SEIR seismicity • In one year, AUH detected: • 463 events recorded by 4 or more hydrophones (red) • 112 events recorded by 3 hydrophones (black). • And 5 clusters (green). • Available focal mechanism solutions from the GCMT catalog are also shown. • Seismicity appears scattered along the ridge, with only few events on ridge segments and most events clustered in the vicinity of transform faults. • One ridge segment at 29˚S, however, is particularly active during the year. The two largest clusters, C6 et C7, are located in the middle of this segment. Further analysis shows that there is a clear magmatic influence in these sequences and reveals the strong influence of magmatic accretion mode for this fast spreading rate ridge. • The other clusters, C2, C3 and C4 are mainly associated with transform faults activity. • Click on a cluster for details. C6 C7 C2 C3 C4
Analysis of the low-levelseismicityalong the SouthernIndianOceanspreadingridges by the OHASISBIO array of hydrophones in 2012 Eve Tsang-Hin-Sun, Jean-Yves Royer, Alexey Sukhovich and Julie Perrot University of Brest and CNRS, Laboratoire Domaines Océaniques X a) b) c) Seismicity rate for the year 2012 as a function of distance from the Rodrigues triple junction. Dotted lines indicate transform faults. b) Number of ISC events since 1964 as a function of distance from the triple junction. Because of the small number of detected events the seismic rate is not computed. Comparison between the AUH (one year) and the ISC (40 years) seismo-acoustic. The two profiles are highly correlated
Analysis of the low-levelseismicityalong the SouthernIndianOceanspreadingridges by the OHASISBIO array of hydrophones in 2012 Eve Tsang-Hin-Sun, Jean-Yves Royer, Alexey Sukhovich and Julie Perrot University of Brest and CNRS, Laboratoire Domaines Océaniques X Context Seismicity along the SWIR Earthquakes along the SWIR are less scattered than along the SEIR. However fewer events are recorded and only one cluster, C1, is found and seems to be associated with the Gazelle transform fault. A weak correlation is found between the long term seismicity recorded since 1964 and the AUH seismicity profile. The spearman rank correlation coefficient is 0.3 for unclustered data and 0.4 for declustered data. Those values show that that there is a clear difference of space variability between the short and long term seismicity along this ridge. The seismicity rate is in average similar to those observed along other ultra-slow spreading centers (e.g. MAR) and exhibits time and space variability. Data Methods Results Next ? C1 4/5
Analysis of the low-levelseismicityalong the SouthernIndianOceanspreadingridges by the OHASISBIO array of hydrophones in 2012 Eve Tsang-Hin-Sun, Jean-Yves Royer, Alexey Sukhovich and Julie Perrot University of Brest and CNRS, Laboratoire Domaines Océaniques X • Close-up on the SWIR seismicity • In one year, AUH detected: • 245 events recorded by 4 or more hydrophones (red) • 83 events recorded by 3 hydrophones (black). • And 1 clusters (green). • Available focal mechanism solutions from the GCMT catalog are also shown. • The eastern part of the SWIR is morphologically characterized by the absence of transform offsets but presents abyssal hills. Seismicity in this area seems to be strongly correlated with abyssal hill faulting. Events are mainly located off-axis. • The low-level seismicity rate is less than along the SEIR but more constant. This is in good agreement with a tectonic dominant mode of accretion. • On the western part, seismicity is less scattered and more clustered along transform faults. The Melville fault zone clearly marks a limit for the seismic signature of the ridge. • Click on a cluster for details. Melville FZ Atlantis II FZ Gauss FZ C1 Gazelle FZ
Analysis of the low-levelseismicityalong the SouthernIndianOceanspreadingridges by the OHASISBIO array of hydrophones in 2012 Eve Tsang-Hin-Sun, Jean-Yves Royer, Alexey Sukhovich and Julie Perrot University of Brest and CNRS, Laboratoire Domaines Océaniques X a) b) c) Seismicity rate for the year 2012 as a function of distance from the Rodrigues triple junction. Dotted lines indicate transform faults. b) Number of ISC events since 1964 as a function of distance from the triple junction. Because of the small number of detected events the seismicity rate is not computed. Comparison between the AUH (one year) and the ISC (40 years) seismo-acoustic. The two profiles are poorly correlated.
Analysis of the low-levelseismicityalong the SouthernIndianOceanspreadingridges by the OHASISBIO array of hydrophones in 2012 Eve Tsang-Hin-Sun, Jean-Yves Royer, Alexey Sukhovich and Julie Perrot University of Brest and CNRS, Laboratoire Domaines Océaniques X Context Seismicity along the CIR The seismicity is limited here to the first 600 km of the CIR. Ridge segments appear mainly aseismic and events are clustered around the transform faults. The seismicity rate is low, even for fault zones. Clusters of events were found but with no more than 10 events, which makes their interpretation difficult. The correlation between the 40 year ISC and one year AUH seismicity is poor, as for the SWIR. Data Methods Results Next ? 5/5
Analysis of the low-levelseismicityalong the SouthernIndianOceanspreadingridges by the OHASISBIO array of hydrophones in 2012 Eve Tsang-Hin-Sun, Jean-Yves Royer, Alexey Sukhovich and Julie Perrot University of Brest and CNRS, Laboratoire Domaines Océaniques X • Close-up on the CIR seismicity • In one year, AUH detected: • 266 events recorded by 4 or more hydrophones (red) • 75 events recorded by 3 hydrophones (black). • And few small clusters. • Available focal mechanism solutions from the GCMT catalog are also shown. • 110 events with SL>SLc have been recorded. Earthquakes mostly occurred along transform fault. • Small clusters where found and seemed to be associated with aftershocks sequence. However, their interpretation is difficult due to the very few number of events in each cluster. It is not clear whether this observation is related to the recording limits of our array (due to the geometry of the array) or to weaker stress release after the mainshocks. A further analysis is required to address these questions.
Analysis of the low-levelseismicityalong the SouthernIndianOceanspreadingridges by the OHASISBIO array of hydrophones in 2012 Eve Tsang-Hin-Sun, Jean-Yves Royer, Alexey Sukhovich and Julie Perrot University of Brest and CNRS, Laboratoire Domaines Océaniques X a) b) c) Seismicity rate for the year 2012 as a function of distance from the Rodrigues triple junction. Dotted lines indicate transform faults. b) Number of ISC events since 1964 as a function of distance from the triple junction. Because of the small number of detected events the seismicity rate is not computed. Comparison between the AUH (one year) and the ISC (40 years) seismo-acoustic. The two profiles are poorly correlated.
Analysis of the low-levelseismicityalong the SouthernIndianOceanspreadingridges by the OHASISBIO array of hydrophones in 2012 Eve Tsang-Hin-Sun, Jean-Yves Royer, Alexey Sukhovich and Julie Perrot University of Brest and CNRS, Laboratoire Domaines Océaniques C1 : SWIR, Gazelle transform fault Supposed mainshock : 08 November 2012 03:24:24 (AUH) - 03:24:28 (ISC), mb 5.1 The cumulative number of aftershocks seems to follow a MOL at the beginning of the sequence but clearly differs after 0.5 days. Aseismic slip effects related to strength fault are suggested. X mb 5.1 aseismic slip ? See table for details
Analysis of the low-levelseismicityalong the SouthernIndianOceanspreadingridges by the OHASISBIO array of hydrophones in 2012 Eve Tsang-Hin-Sun, Jean-Yves Royer, Alexey Sukhovich and Julie Perrot University of Brest and CNRS, Laboratoire Domaines Océaniques C2: SEIR, transform fault Supposed mainshock : 07 February 2013 07:38:12 (AUH) - 07:38:18 (ISC), mb 5.0 X mb 5.0 See table for details
Analysis of the low-levelseismicityalong the SouthernIndianOceanspreadingridges by the OHASISBIO array of hydrophones in 2012 Eve Tsang-Hin-Sun, Jean-Yves Royer, Alexey Sukhovich and Julie Perrot University of Brest and CNRS, Laboratoire Domaines Océaniques C3 : S/A hotspot Supposed mainshock : 12 November 2012 23:02:14 (AUH) - 23:02:23 (ISC), Mw 5.3 This sequence occurred on a transform fault related to the St-Paul and Amsterdam hotspot. However, even if a transform mechanism is provided by the GCMT, it was not possible to fit a MOL. The distribution of aftershocks in time suggest the influence of the hotspot on the tectonic activity of the ridge. Magmatic intrusion or thermal effects may induced changes in the strength of transform fault. X Mw 5.3 See table for details
Analysis of the low-levelseismicityalong the SouthernIndianOceanspreadingridges by the OHASISBIO array of hydrophones in 2012 Eve Tsang-Hin-Sun, Jean-Yves Royer, Alexey Sukhovich and Julie Perrot University of Brest and CNRS, Laboratoire Domaines Océaniques C4: S/A hotspot Supposed mainshock : 18 September 2012 21:41:30 (AUH) - 21:41:38 (ISC), mb4.1 The few number of events makes interpretation difficult. X mb 4.1 See table for details
Analysis of the low-levelseismicityalong the SouthernIndianOceanspreadingridges by the OHASISBIO array of hydrophones in 2012 Eve Tsang-Hin-Sun, Jean-Yves Royer, Alexey Sukhovich and Julie Perrot University of Brest and CNRS, Laboratoire Domaines Océaniques C6: SEIR segment, ~29˚S Supposed mainshock : 05 July 2012 01:56:35 (AUH) The sequence is clearly not related to a classical shock/aftershock process. No fitting was found for the MOL. This cluster is defined as a tecto –magmatic swarm. The distribution of events in time strongly suggest a magmatic episode, such as dyke intrusion, that induced activation or reactivation of normal faults in the axial valley. X mb 4.6 Mw 4.9 Mw 5.0 See table for details
Analysis of the low-levelseismicityalong the SouthernIndianOceanspreadingridges by the OHASISBIO array of hydrophones in 2012 Eve Tsang-Hin-Sun, Jean-Yves Royer, Alexey Sukhovich and Julie Perrot University of Brest and CNRS, Laboratoire Domaines Océaniques C7: SEIR segment, ~29˚S Supposed mainshock :12 December 2012 02:10:07 (AUH) – 02:10:13 (ISC), Ms 4.6 The cumulative number of aftershocks seems to follow a MOL at the beginning of the sequence but clearly differs after 0.5 days. Aseismic slip effects related to strength fault are suggested. This sequence occurred 6 months after the large tecto-magmatic swam C6 and suggests the reactivation of faults, induced by fluids circulation. X Ms 4.6 aseismic slip ? See table for details
Analysis of the low-levelseismicityalong the SouthernIndianOceanspreadingridges by the OHASISBIO array of hydrophones in 2012 Eve Tsang-Hin-Sun, Jean-Yves Royer, Alexey Sukhovich and Julie Perrot University of Brest and CNRS, Laboratoire Domaines Océaniques Context • Further analysis and interpretation based on : • An additional AUH seismicity catalog for 2007 • Improved relocalizations of our catalog using the 2 permanent hydroacoustic stations in the Indian Ocean (CTBTO) • A detail analysis along ridge segments of • Seismicity vs geomorphology • Seismicity vs mantle Bouguer gravity anomaly (MBA) as a proxy to the thermal regime of the spreading ridges Data Methods Results Next ?
Analysis of the low-levelseismicityalong the SouthernIndianOceanspreadingridges by the OHASISBIO array of hydrophones in 2012 Eve Tsang-Hin-Sun, Jean-Yves Royer, Alexey Sukhovich and Julie Perrot University of Brest and CNRS, Laboratoire Domaines Océaniques
Analysis of the low-levelseismicityalong the SouthernIndianOceanspreadingridges by the OHASISBIO array of hydrophones in 2012 Eve Tsang-Hin-Sun, Jean-Yves Royer, Alexey Sukhovich and Julie Perrot University of Brest and CNRS, Laboratoire Domaines Océaniques
Analysis of the low-levelseismicityalong the SouthernIndianOceanspreadingridges by the OHASISBIO array of hydrophones in 2012 Eve Tsang-Hin-Sun, Jean-Yves Royer, Alexey Sukhovich and Julie Perrot University of Brest and CNRS, Laboratoire Domaines Océaniques