Download
1 / 34
340 likes | 434 Views
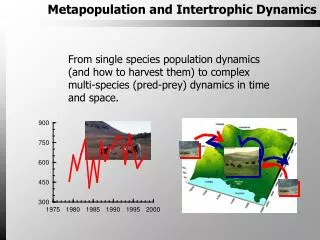
Understanding North Sea ecosystem dynamics: Is 3 decades enough?. Chris Frid School of Biological Sciences. The North Sea. The North Sea is a semi-enclosed, highly productive ( >300 g C m -2 yr -1 ), relatively shallow, temperate sea.

E N D
Understanding North Sea ecosystem dynamics: Is 3 decades enough? Chris Frid School of Biological Sciences
The North Sea The North Sea is a semi-enclosed, highly productive (>300 g C m-2 yr-1), relatively shallow, temperate sea. • A variety of human activities affect the marine ecosystem: • nutrient enrichment, • coastal developments, • the fisheries.
Main Nephrops ground P Z M1 The Dove Time Series: • Zooplankton – Station Z • Macro-benthos – two stations M1 and P
Benthos • Buchanan initiated in 1971-72 • Two stations remain from an extensive grid • 6 and 12 miles offshore • 50 and 70 m deep • M1 sampled March and September • P sampled March
Benthos – M1 • At M1 the first decade showed stable biennial cycle. • Buchanan interpreted thisas evidence of density dependence (?food limitation). • Broke down in 1981. • From 1981-91 correlation of benthic abundance with phytoplankton productivity two years previous (r2=55%) [whole series r2~33%]
% Similarity Benthos Station P • Station P tracks phytoplankton until fishing increases in the 1980’s then declines. • Little year to year variation in species composition at Stn M1 (1986 decreased abundance of many taxa) • Stn P the same until mid 1980’s when fishing increased and inter-annual variability increased.
M1- 35 years of “natural” variation Since September 1972 • Have missed 3 September (1987,1991, 2002) and 1 March (1998) sampling • 516 taxa recorded • Genera richness: Sept: mean 105 (70-129) Mar: mean 94 (63-124) • Abundance: Sept: mean 605 (224-1310)(per grab) Mar: mean 380 (104-720)
Some biology Worms dominate, with brittlestars, burrowing urchins and clams (bivalve molluscs) Prionospio Levinsenia gracilis Amphiura Thyasira
Changes in time • No significant change in total abundance over time nor between decades • Indication of altered variability and multi-annual shifts • Significant change (ANOVA p<0.001) in genera richness, significantly higher in the 1990s and 2000s.
Global Climate Change • Clear evidence of warming • Rate of change is increasing • Kicks off in late 1970s
Time Series – Std NAO, Abundance and Richness (genera) September
Time Series – Std NAO, Abundance and Richness (genera) March
Climate Variation – A driver? Winter NAO and • March Abundance • March Genera richness • Sept. Abundance • Sept. Genera richness • No relationship with any variable (<5% variance explained)
Top 2 taxa Not synchronised
Total Abundance • Variation in the abundance of the polychaete Levinsenia (rank 2) accounts for over 31% of the variation in the total abundance • A multiple regression of Levinsenia and the brittlestars Amphiura (rank 4) together accounts for over 50% of the variation in the total abundance
Genera richness • Total abundance explains around 28% of the variation in Genera Richness • 35% with a quadratic fitted to logged data • Amphiura abundance explains 11% of the variation in genera richness
Shifts in community structure Something happened between Sept 1984 and March 1985 And 1999 was an odd year (especially September) March shows shifts in: • 1985-1986, • 1990-1991, 1991-1992 • 1998-1999, 1999-2000 September shows shifts in: • 1984-1985 • 1998-1999, 1999-2000
Food as a driver? CPR greenness (2 years previous) and Total (March) abundance 1970s ns r2=6% 1980s Signif. r2=24% 1990s ns r2=<1% Total Series: • March Abundance – ns r2= 5% • March Genera richness - Signif. r2=15% • Sept. Abundance - ns • Sept. Genera richness - Signif. r2=17.7%
Drivers of Biodiversity • March – Greenness and Total Abundance explain over 25% of Genera Richness • Sept – Greenness and Total Abundance explain over 40% of Genera Richness
35 years of study shows.. • Decadal scale variation in total abundance, species richness and community composition • No trend in abundance i.e. due to warming or eutrophication • ‘Trend’ in community composition and hence deliver of ecological functions • Indication of importance of climatic drivers (variation) and food supply in setting limits on total abundance and patterns of richness
Take home message • 10 taxa account for over 40% of the individuals recorded • Richness and total abundance tend to change together: Richness has increased over time • Climatic variation directly and the variation in food supply (which is influenced by climate) are important drivers • Our understanding of this system continues to develop as the series lengthens
And where next? • We continue, in conjunction with Newcastle University, to extend the time series • We have also, in 2006, initiated benthic sampling twice a year at two of the Coastal Observatory stations
Acknowledgements • For initiating the series Jack Buchanan and for collecting the data: various PhD students and Peter Garwood, masters and crew of the RV Bernicia • For funding it at various times: DEFRA (DoEnv, DETR), NERC, University of Newcastle • For intellectual input: Leonie Robinson, Robin Clark, Kirsty Nicholas.