Download

1 / 20
210 likes | 259 Views
GROUP 4. INTERFERENCE . FIRDIANA SANJAYA ( 4201414050 ) ANA ALINA (4201414095).

E N D
GROUP 4 INTERFERENCE FIRDIANA SANJAYA (4201414050) ANA ALINA (4201414095)
The colors in many of a hummingbird’s feathers are not due to pigment. TheIridescencethat makes the brilliant colors that often appear on the throat and belly is due to aninterference effect caused by structures in the feathers.
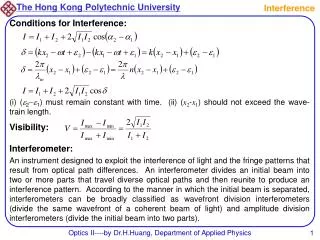
Conditions for Interference • The sources must be coherent—that is, they must maintain a constant phasewith respect to each other. • The sources should be monochromatic—that is, of a single wavelength.
Young’s Double-Slit Experiment • A common method for producing two coherent light sources is to use a monochromatic source to illuminate a barrier containing two small openings (usually in theshape of slits). The light waves from thetwo slits overlap as they spread out,filling what we expect to beshadowed regions with light and producing interference fringes on ascreen placed to the right of the slits. If light waves didnot spread out after passing throughthe slits, no interference wouldoccur.
At a beach in Tel Aviv, Israel, plane water waves pass through two openings in a breakwall.
Schematic diagram of Young’s double-slit experiment. Slits S1and S2 behave as coherent sources of light waves that produce an interference patternon the viewing screen (drawing not to scale). An enlargement of the center of afringe pattern formed on the viewing screen.
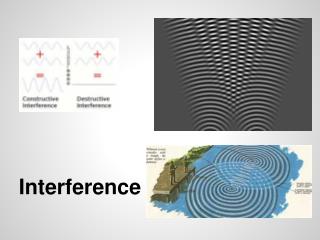
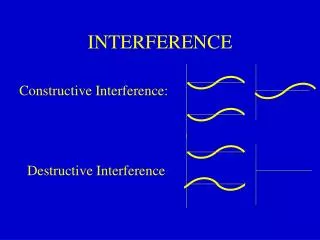
Constructive interference occurs at point P when the waves combine.(b) Constructive interference also occurs at point Q. (c) Destructive interferenceoccursat R when the two waves combine because the upper wave falls half a wavelengthbehind the lower wave. (All figures not to scale.)
(a) Geometric construction for describing Young’s double-slit experiment(not to scale). (b) When we assume that r1 is parallel to r2, the path difference betweenthe two rays is r2 -r1=d sin . For this approximation to be valid, it is essential thatL >>d.
The value of " determines whether the two waves are in phase when they arrive atpoint P. If is either zero or some integer multiple of the wavelength, then the twowaves are in phase at point P and constructive interference results. Therefore, thecondition for bright fringes, or constructive interference, at point P is • When " is an odd multiple of &/2, the two waves arriving at point P are 180° out ofphase and give rise to destructiveinterference. Therefore, the condition for darkfringes, or destructive interference, at point P is
Intensity Distribution of the Double-SlitInterference Pattern • suppose that the two slits represent coherent sources of sinusoidal wavessuch that the two waves from the slits have the same angular frequency - and aconstant phase difference .. The total magnitude of the electric field at point P on thescreen in Figure 37.6 is the superposition of the two waves. Assuming that the twowaves have the same amplitude E0, we can write the magnitude of the electric field atpoint P due to each wave separately as
A plot of light intensity versus d sin! is given in Figure.The interferencepattern consists of equally spaced fringes of equal intensity. Remember, however, thatthis result is valid only if the slit-to-screen distance L is much greater than the slitseparation, and only for small values of
Phasor Addition of Waves • (a) Phasor diagram for the wave disturbance E1=E0 sint . The phasorsa vector of length E0 rotating counterclockwise. (b) Phasor diagram for the waveE2 =E0 sin(t+)(c) The phasor ER represents thecombination of the waves inpart (a) and (b).
Phasor Diagrams for Two Coherent Sources As an example of the phasor method, consider the interference pattern producedby two coherent sources. The light intensity at a point is a maximum when ER is a maximum; this occurs at . # 0, 2/, 4/,.... The lightintensity at some point is zero when ER is zero; this occurs at . # /, 3/, 5/,....These results are in complete agreement with the analytical procedure described inthe preceding section. • Three-Slit Interference Pattern Using phasor diagrams, let us analyze the interference pattern caused by three equallyspaced slits. We can express the electric field components at a point P on the screencaused by waves from the individual slits as
Phasor diagrams for a double-slit interference pattern. Theresultant phasor ER is a maximum when .0, 2/, 4/, . . . and is zero when .= /,3/, 5/, ....
Change of Phase Due to Reflection • an electromagnetic wave undergoes a phase change of 180°upon reflection from a medium that has a higher index of refraction than theone in which the wave is traveling.