Download

1 / 27
270 likes | 382 Views
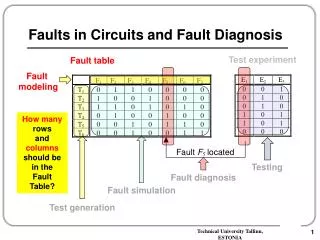
On Diagnosis of Multiple Faults Using Compacted Responses. Jing Ye 1,2 , Yu Hu 1 , and Xiaowei Li 1 1 Key Laboratory of Computer System and Architecture Institute of Computing Technology Chinese Academy of Sciences 2 Graduate University of Chinese Academy of Sciences. Motivation.

E N D
On Diagnosis of Multiple Faults Using Compacted Responses Jing Ye1,2, Yu Hu1, and Xiaowei Li1 1 Key Laboratory of Computer System and ArchitectureInstitute of Computing Technology Chinese Academy of Sciences 2 Graduate University of Chinese Academy of Sciences
Motivation With the exponential growth in the number of transistors: • Multiple faults may exist in one circuit. • Both of test data volume and test application time increase. ATE: Automatic Test Equipment CUT: Circuit Under Test It is necessary to diagnose multiple faults using compacted responses. SOURCE:L.-T. Wang, C.-W. Wu, and X. Wen, “VLSI Test Principles and Architectures: Design for Testability,” Morgan Kaufmann, San Fransico, 2006.
Outline • Related Works • Terminology • Explanation Capability • Explanation Necessity • Issue of Compacted Responses • Diagnosis Method • Suspect Fault Marking • Suspect Fault Simulation • Suspect Fault Evaluation • Suspect Fault Ranking • Experimental Results
Related Works Fault diagnosis approaches using compacted responses can be classified into three categories: • Bypassing diagnosis Bypass space compactor [ J. Ye, Y. Hu, et al., DATE10 ] [ F. Wang, Y. Hu, et al., ITC09 ] • Indirect diagnosis Mathematically de-compact the compacted responses [ H.P.E. Vranken, S.K. Goel, et al., DAC06 ] [ J. Rajski, J. Tyszer, et al., ITC03 ] • Direct diagnosis Use space compactor Compare actually observed responses with simulated compacted responses [ S. Holst, H.-J. Wunderlich, DATE09 ] [ W.-T. Cheng, K.-H. Tsai, et al., ATS04 ] Our method is a direct diagnosis method.
Terminology Explanation Capability The explanation capability of a suspect fault reflects the match degree between its simulated responses and the actually observed responses.
Terminology Explanation Capability Following is an example of a CUT under one failing pattern. ( OP: Observation Point )
Terminology Explanation Capability Following is an example of a CUT under one failing pattern. ( OP: Observation Point )
Terminology Explanation Capability Two measures: • σ: The number of explained failing OPs of one pattern. • ι: The number of contaminated passing OPs of one pattern. • A suspect fault with a high ( σ – ι ) reflects its high explanation capability. ( OP: Observation Point )
Terminology Explanation Necessity The explanation necessity of a suspect fault reflects its importance for matching the observed responses.
Terminology Explanation Necessity The explanation necessity of a suspect fault reflects its importance for matching the observed responses. • Nce:The number of suspect faults which can contaminate/explain a passing/failing observation point. • Each observation point is given a weight ω = .
Issue of Compacted Responses • Using uncompacted responses, when multiple faults exist, the suspect faults with the highest explanation capability often hit the actual faults [9]. The situation, that the actual faults do not show the highest explanation capability, rarely occurs. • This situation becomes serious when using compacted responses. Actual faults: a/0 (a-stuck-at-0), c/0 Failing observation points: Cell11, q Suspect faults: a/0(d/1), c/0(q/0) [9] J. Ye, Y. Hu, and X. Li, “Diagnosis of Multiple Arbitrary Faults with Mask and Reinforcement Effect,” Proc. of Design, Automation, and Test in Europe (DATE), pp. 885-890, 2010.
Issue of Compacted Responses • Using uncompacted responses, when multiple faults exist, the suspect faults with the highest explanation capability often hit the actual faults [9]. The situation, that the actual faults do not show the highest explanation capability, rarely occurs. • This situation becomes serious when using compacted responses. Actual faults: a/0 (a-stuck-at-0), c/0 Failing observation points: Cell11, q Suspect faults: a/0(d/1), c/0(q/0) Failing observation points: OP1, q Suspect faults: b/0 Explanation capability alone is not enough for selecting right suspect faults. [9] J. Ye, Y. Hu, and X. Li, “Diagnosis of Multiple Arbitrary Faults with Mask and Reinforcement Effect,” Proc. of Design, Automation, and Test in Europe (DATE), pp. 885-890, 2010.
Issue of Compacted Responses Combine explanation capability and explanation necessity • Each suspect fault is given a score ε under one given pattern:
Diagnosis Method Marking Simulation Evaluation Ranking
Diagnosis Method Marking • Suspect Fault Marking • Search failing observation points’ related logic cones. Simulation Evaluation Ranking
Diagnosis Method Marking Simulation • Suspect Fault Simulation • Each single suspect fault is simulated under all the given patterns to record their compacted responses. • The structure of space compactor is known. Evaluation Ranking
Diagnosis Method Marking Simulation • Suspect Fault Evaluation • Each suspect fault is given a score ε under each given pattern: Evaluation Ranking • The Final Score (FS) of a suspect fault is the sum of its scores under all given patterns.
Diagnosis Method Suspect Fault Ranking Marking Simulation Evaluation Ranking ( OP: Observation Point )
Experimental Results Experimental Setup • Benchmark circuits: ISCAS’89, ITC’99 • Test patterns: Generated by a commercial ATPG tool • Injected fault types: Stuck-at faults, Transition faults • Space compactor: • For each circuit, each number of multiple faults, each type of faults, and each compaction ratio, 100 diagnosis cases are conducted. [20] S. Holst, H.-J. Wunderlich, “A Diagnosis Algorithm for Extreme Space Compaction,” Proc. of Design, Automation, and Test in Europe (DATE), pp. 1355-1360, 2009.
Experimental Results Evaluation Metrics • Success rate In this work, only the accuracy of the most likely suspect faults is concerned. A diagnosis case is considered successful if the top-ranked suspect faults hit at least one actual fault. • Experimental focus Success rate vs Compaction ratio Success rate vs The number of injected faults • Comparison with [20] S. Holst, H.-J. Wunderlich, “A Diagnosis Algorithm for Extreme Space Compaction,” Proc. of Design, Automation, and Test in Europe (DATE), pp. 1355-1360, 2009.
Experimental Results Success rate vs Compaction ratio • S (%): Success rate of our method • ΔS (%): Success rate of our method - Success rate of the method proposed in [20] • T (seconds): Average run time of diagnosis in our experiments [20] S. Holst, H.-J. Wunderlich, “A Diagnosis Algorithm for Extreme Space Compaction,” Proc. of Design, Automation, and Test in Europe (DATE), pp. 1355-1360, 2009.
Experimental Results Success rate vs Compaction ratio • S (%): Success rate of our method • ΔS (%): Success rate of our method - Success rate of the method proposed in [20] • T (seconds): Average run time of diagnosis in our experiments [20] S. Holst, H.-J. Wunderlich, “A Diagnosis Algorithm for Extreme Space Compaction,” Proc. of Design, Automation, and Test in Europe (DATE), pp. 1355-1360, 2009.
Experimental Results Success rate vs Compaction ratio • Compaction ratio = 2 • Compaction ratio = 32 94.98% 99.94% 86.47% 98.64% s9234, s13207, s15850, s35932, s38417, s38584, b17, b20, b22 [20] S. Holst, H.-J. Wunderlich, “A Diagnosis Algorithm for Extreme Space Compaction,” Proc. of Design, Automation, and Test in Europe (DATE), pp. 1355-1360, 2009.
Experimental Results • Success rate vs The number of injected faults • Compaction ratio = 32 • S (%): Success rate of our method • ΔS (%): Success rate of our method - Success rate of the method proposed in [20] • T (seconds): Average run time of diagnosis in our experiments [20] S. Holst, H.-J. Wunderlich, “A Diagnosis Algorithm for Extreme Space Compaction,” Proc. of Design, Automation, and Test in Europe (DATE), pp. 1355-1360, 2009.
Experimental Results Success rate vs The number of injected faults • Number of injected faults = 2 • Number of injected faults = 32 91.4% 99.2% 49.8% 93.3% ( Compaction ratio = 32 ) s9234, s13207, s15850, s35932, s38417, s38584, b17, b20, b22 [20] S. Holst, H.-J. Wunderlich, “A Diagnosis Algorithm for Extreme Space Compaction,” Proc. of Design, Automation, and Test in Europe (DATE), pp. 1355-1360, 2009.
Conclusion • Propose the explanation necessity. • Combine the explanation capability and the explanation necessity: • 98.8% of top-ranked suspect faults hit actual faults.
Thank You For Your Attention! • Questions?