Download
1 / 27
270 likes | 395 Views
The motivation to use image recognition techinques in investigations of solar photosphere. Kasia Mikurda , Friedrich Wöger Kiepenheuer Institut Für Sonnenphysik Freiburg, Germany. Photospheric structures. sunspots , active regions (ARs) granulation faculae

E N D
The motivation to use image recognition techinques in investigations of solar photosphere Kasia Mikurda, Friedrich Wöger Kiepenheuer Institut Für Sonnenphysik Freiburg, Germany
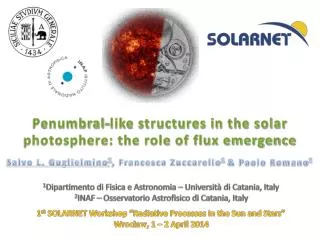
Photospheric structures • sunspots, active regions (ARs) • granulation • faculae • photospheric bright points (G-band bright points, filigree...)
Our goal • Our data: G-band images and LOS velocity maps (obtained from the FeI line at 557.6 nm with TESOS – triple Fabry-Perot interferometer at VTT) • Our aims: - to detect the BPs in the G-band images- to find the corresponding structures on the velocity maps- to trace BPs in order to find their horizontal motions- to combine the results in order to get the 3D velocity vector of BPs
Examples of papers • sunspots • Turmon et al, 2002 • granulation • Bovelet & Wiehr, 2001 • Roudier & Muller, 1986 • Hirzberger et al, 1997 • faculae • Bovelet & Wiehr, 2001 • photospheric bright points • Berger et al, 1998 • Ballegooijen et al, 1998 • Nisenson et al, 2003
Sunspots(Turman et al, 2002) • investigation of solar cycle (magnetic flux, intensity) • identification and labelling of sunspots and ARs on SOHO/MDI images • good for searching in large image databases
Granulation(Roudier and Muller, 1986; Hirzberger et al, 1997) • FBR (Fourier Based Recognition) • Investigations of distribution of sizes, and brightness of granules • 2-D passband Fourier filter is applied to the data and preserve only those frequencies that are expected to be characteristic for granular structures
Granulation(Bovelet & Wiehr, 2001) • MLT (multilevel tracking) • application: mostly the same as previously mentioned method • uses iterative tresholding with multiple clip levels • recognizes and tags structures • unfortunately not yet well documented
G-band bright points(Berger et al., 1998) • G-band bright points are detected on the differential images (G-band image – wideband image @ 468.6 nm) by thresholding • measures the location of the centroid of GBPs • tracks the centroid location from one frame to consecutive one
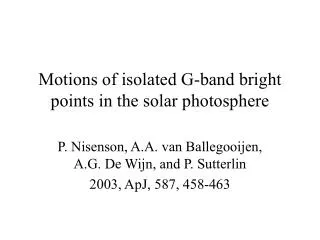
G-band bright points(Nisenson et al, 2003) • G-band bright points are recognized visually • positions of G-band bright points are traced in a reference frame tied to the solar granulation • the GBs are then followed using correlation tracking (only clearly separated BPs are used) • only good for smaller amount of investigated structure
G-band bright points(Ballegooijen et al., 1998) • uses small circular discs (´corks`) to represent the brightenings on G-band images • uses ´magnetic images´ (difference images made by substracting the 468.6 nm images from the corresponding G-band images) • in the first step corks are randomly distributed • an artificial flow field proportional to the intensity gradient in the magnetic image is introduced • corks are driven to the brightest regions in the image • the velocities of the corks represent the velocities of GBPs • good for statistical investigation of velocities
References • Ballegoijen et al, 1998, ApJ 509, 435 • Berger et al, 1998, ApJ 495, 973 • Bovelet & Wiehr, 2001, SPh 201, 13 • Hirzberger et al, 1997, ApJ 480, 406 • Nisenson et al, 2003, ApJ 587, 458 • Roudier & Muller, 1986, SPh 107, 11 • Turmon et al., 2002, ApJ 568, 396
Discussion What kind of method of recognizing and tracing is the best for us ?
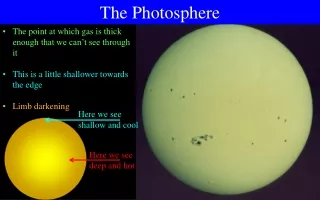
Sunspots • sizes: about few tousands of km in diameter (up to 30.000 km) • lifetime: from hours to weeks
Granulation • size: 1-2” • characteristic time scale: ~8 min (up to 15 min) • contrast between granules and intergranular lanes: ~10-30%
Faculae • often associated with sunspots, but can also exist apart from them • longer living than spots, lifetimes even up to 90 days • important in investigation of solar irradiance variation
G-band bright points • sizes: 150-250 km (up to 600 km) • lifetimes: ~8-9 min • splitting and merging time scale: ~3-4 min • horizontal motion: ~0.8 km/s (up to several km/s)