Download
1 / 44
440 likes | 558 Views
Institute for Sustainable Regional Development. Value Adding to Regional Planning Processes - Community Wellbeing Presentation by Lindsay Greer and David Kraatz. Regional Social Impacts of Economic Growth Forum August 2007. In partnership with CQANM. Presentation outline.

E N D
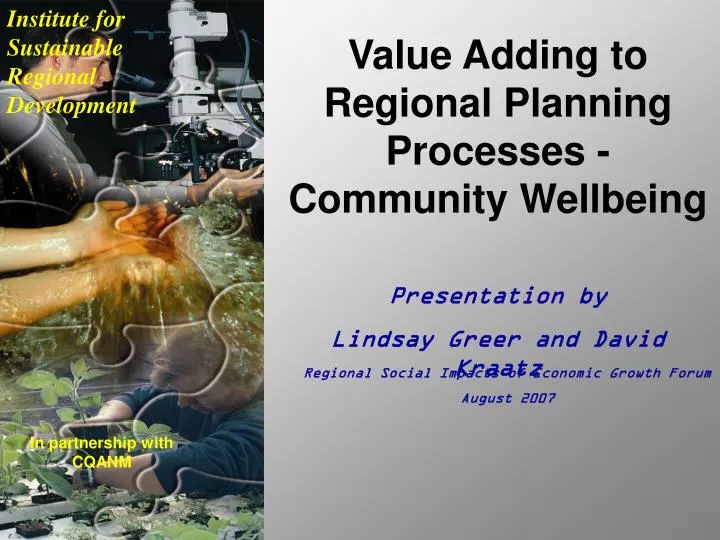
Institute for Sustainable Regional Development Value Adding to Regional Planning Processes - Community Wellbeing Presentation by Lindsay Greer and David Kraatz Regional Social Impacts of Economic Growth Forum August 2007 In partnership with CQANM
Presentation outline • Key challenges for regional Queensland • Concerns with regional data • Framework for community wellbeing • Existing studies • Central Queensland case study • Regional planning processes • Conclusion
Objective • To offer an explanation and a rationale for the inclusion of a set of social and community indicators of wellbeing into contemporary regional planning processes • To develop a sustainable model for a set of community wellbeing indicators that is clearly linked to government policy and draws on local experience, knowledge and concerns
Why? • Currently in a period of sustained growth • Growth is not uniform • Will not last forever • We need the best available evidence to inform • Decision making • Citizen engagement • Community planning
Key Challenges • Increasing globalisation of markets • Increasing competition between regions • Growing corporatisation (off-shore decision making) • Rapid technology change • Population changes • Changes in regional age compositions
More challenges • Skills shortage • Increased worker mobility • Increased career expectations/mobility • Infrastructure bottlenecks • Environment and heritage issues • Community wellbeing issues • Economy/tourism issues • Governance issues
Problems with existing regional data • Lack of consistent data • Irregularity of updated datasets • Limited resources to update data • Difficulties accessing data • Multiple/conflicting data sets being used • Difficulty doing regional comparisons • Lack of small area data • Cost • Lack of social indicators
Framework for community wellbeing project • Data collection and dissemination that is: • Regionally based and relevant • Regularly updated • Economic to produce • Easily understood • Consistent • Able to measure change • Included social data as well as economic, environmental & governance
Framework for community wellbeing • Four fundamental resources (capitals) • Natural capital – natural resources, ecosystems and aesthetic features • Produced economic capital – manufactured or harvested goods and services • Human capital – skills and knowledge • Social and institutional capital – OECD definition ‘networks, together with shared norms, values and understandings which facilitate cooperation within or among groups’
Social capital • Social capital is seen as a resource that draws on and feeds back into the other three resources • They all contribute to a wide range of wellbeing outcomes • Attributes – social participation (networks, bonds and bridges) • Qualities (strength) such as trust, altruism and reciprocity
Socialcapital • Productivity Commission report (2003) • Communities with good SC tend to be more ‘hired, housed, healthy and happy’ • However, PC concludes ‘there is a limited understanding of SC and how different policies interact with it, and measurement is difficult’ • Can public policy increase existing stocks of social capital?
Community Wellbeing • Measuring wellbeing is a critical role for Government • Vital for knowing how the community is faring • Must involve a set of indicators that are statistically robust and reliable, and accurate • Must be relatively easy to use and interpret • Assist policy development processes to respond to complex challenges confronting legislators and citizens.
Measuring Wellbeing • No single measure of wellbeing that satisfies all parties all the time • Select to inform particular issues of interest • Some indicators are fundamental to wellbeing (e.g. health status, inequality measures, unemployment rates) • Wellbeing indicators influenced by the concerns of contemporary culture • Focus on conditions that can be influenced by policy and intervention (ABS, 2001: 6)
The State of Play Who is doing what South Australia – based on Oregon Shine Project and closely integrated to six main objectives of SA strategic plan (top down approach) Tasmania Together 2020 - twenty year Social, Environmental and Economic Plan. Closer community consultation than SA Victorian Community Indicators (VCI)– a Vic Health funded project – broad partnership btw State Gov’t and Communities (79 LGA’s)
The State of Play Who is doing what cont: • Canada – Newfoundland & Labrador Community Accounts – joint citizen – government project • OECD – Long term project ‘Global Project on Measuring the Progress of Societies’ • Queensland – Currently have the Healthy communities project • Dept of Communities - keep in-house profiles on wellbeing
A Case Study Approach • Partnership Approach • CQANM • Emerald Shire Council • Institute for Sustainable Regional Development Central Queensland University • Emerald as the area under study • conducted concurrently with their regular customer satisfaction survey
Project Drivers Two key drivers behind this project • The need to adequately inform local government strategic planning requirements – identified gap in data collection • Existing LGA data collection could be value added
Framework for the model • Integrated, strategic and sustainable approach • Driven by ‘bottom up’ demand from communities, local gov’t and regional officers • Able to also inform state planners and policy – ‘top down’
Sustaining the Process Allows for qualitative review by community/ expert panel Data collection ‘piggy backs’ on existing survey
Top down approach:Policy areas/social dimensions that constitute the six domains Social Environmental Economic Domains Wealth & Affordability Safety & Public Health Personal Health & Fitness Diversity & Learning Community & Governance Environment & Infrastructure Governance Cultural
Bottom up approach: indicator sources that constitute the six domains Existing Data Sets LGA Questions Regional Issues Domains Wealth & Affordability Safety & Public Health Personal Health & Fitness Diversity & Learning Community & Governance Environment & Infrastructure Demographic Data Community Issues
Indicator Framework The indicators have been divided into a framework of domains that correspond with a set of policy areas and concerns. • Wealth & Affordability • Safety & Public Health • Personal Health & Fitness • Diversity & Learning • Community & Governance • Environment & Infrastructure
Key Features of the 6x6 Domain Framework: • Incorporates TBL (economic, social & environment) • Objective/ subjective mix of indicators within each domain • Use of multiple indicators for some indicator headings • Utilisation of existing data where possible
Key Features of the 6x6 Domain Framework: • Utilisation of Local Government community survey • Three tiered survey instrument structure (local government, community wellbeing and regional issue sections) • Allows for critique & review of indicators
Selected ResultsHousing Activity Source: OESR, DNR
Selected ResultsCitizen engagement Source: Web sites
Radar diagram - Community Wellbeing for Emerald, Calliope and Rockhampton.
Summary of recoded mean scores for ‘trust and influence’ community wellbeing variables within the sample area.
Number of organisations that residents are involved in which are (a) locally based or (b) outside the local area (B) (A)
Croc found in Fitzroy river then mauled by three savage dogs
Legislative Framework - IPA / IDAS Review • Recommendations on Regional Planning practices and processes may include things like: • Enhanced State planning instruments: statutory regional plans, State planning policies & standard planning scheme provisions • Legislate to ensure State instruments take precedence over local planning instruments where conflict occurs • Regional plans should be the pre-eminent instrument
CQANM Project Aims • Providing strategies designed to improve the quality of life for communities, particularly regarding access to facilities and services, infrastructure provision and sustainable environmental practices. • Providing governments with a regional focus on fundamental strategic planning issues.
CQANM Project Aims • Providing a decision making framework which ensures complementary actions by the Australian, State and local governments and the private and community sectors to create desirable long term growth and development objectives and avoid duplication and inefficient use of resources. • Forming the basis of a comprehensive regional framework to be implemented through local government strategic plans and providing guidance for State and local government planning and development decisions. • Positioning the region to maximise competitive advantage and future sustainability.
Planning Project Responses to Bowen Basin Mining Boom • Sustainable Futures Framework for Queensland Mining Towns • FTE Population Survey 2006 (PIFU) • Central Queensland Community Wellbeing Indicators (Pilot Study: Emerald Shire)
Conclusion The model can value add by: • Encouraging a compatible minimum standard for regional community surveys • Benchmarking a set of indicators that can be aligned to regional policy and planning
Conclusion The model can value add by: cont • Measuring regional performance across a broad range of indicators that encompass the TBL • Encouraging further in-depth examination of areas identified as significant
How to get it to work? Experience of other projects indicates that success requires: • A partnership approach • Strong regional support • Stakeholders must see clear benefits that relate directly to their planning mechanisms
How to get it to work? Experience of other projects indicates that success requires: • It must support evidence based – informed decision making • Equally important it should advance community engagement and better inform citizens