Download
1 / 23
230 likes | 351 Views
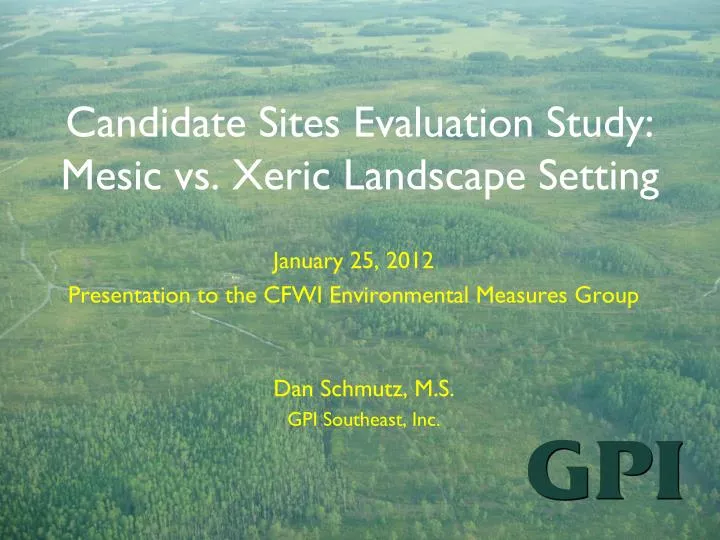
Candidate Sites Evaluation Study: Mesic vs. Xeric Landscape Setting. January 25, 2012 Presentation to the CFWI Environmental Measures Group. Dan Schmutz, M.S. GPI Southeast, Inc. Acknowledgments. Tampa Bay Water SDI Environmental Services, Inc. Shirley Denton, Ph.D., C.E.P.

E N D
Candidate Sites Evaluation Study:Mesic vs. Xeric Landscape Setting January 25, 2012 Presentation to the CFWI Environmental Measures Group Dan Schmutz, M.S. GPI Southeast, Inc.
Acknowledgments • Tampa Bay Water • SDI Environmental Services, Inc. • Shirley Denton, Ph.D., C.E.P.
Take Home Message In areas with a lack of actual data, landscape setting, as defined by surrounding soil types, may be used to improve prediction of isolated wetland water level responses to water table changes.
Candidate Sites Evaluation Study A condition of Tampa Bay Water’s original Consolidated Permit (1999) required a hydrologic recovery analysis predicting the magnitude of water level recovery at Candidate Site* wetlands and lakes due to scheduled pumpage reductions at 11 public supply wellfields. *sites with unacceptable adverse impacts within study area
Potential Candidate Sites 28,000 acres, 1631 sites
Pre-Development Wetland For monitored sites use linear regression to predict staff levels from well levels
Wetland Sites Used in Development of Recovery Analysis Methodology
GIS buffer analysis (500 Ft) %Xeric = Areas (Xeric/(Xeric + Mesic)) >34% Xeric = Xeric-associated Determining Xeric/Mesic-association
Xeric-associated deep marsh in sand pine scrub matrix (west Starkey)
Mesic-associated shallow cypress in pine flatwoods matrix (east Starkey)
Xeric-associated Surrounded by sandhill, scrub, or scrubby flatwoods Mesic-associated Surrounded by pine flatwoods Two Wetland Types
Distribution of Aboveground Slopes by Soil Type Xeric mean slope= 0.67 Mesic mean slope = 0.28
Conceptual Drawdown/Recovery Xeric mean depth = 3.84 Mesic mean depth = 1.87
Conclusions • Belowground slopes same for all • Aboveground slopes for xeric-associated sites are steep (mean=0.67) • Aboveground slopes for mesic-associated sites are shallow (mean=0.28) • Mesic-associated sites less vulnerable to SAS drawdown • Xeric-associated sites more vulnerable to SAS drawdown
Questions? dschmutz@gpinet.com