Download
1 / 1
10 likes | 83 Views
FINITE ELEMENT ANALYSIS OF DYNAMIC INSTRUMENTATION DEMONSTRATES STRESS REDUCTION IN ADJACENT LEVEL DISCS +Hao Huang , +Saigal Sunil, + Tov Vestgaarden, *Antonio E. Castellvi, *Deborah H Clabeaux, ** David Pienkowski

E N D
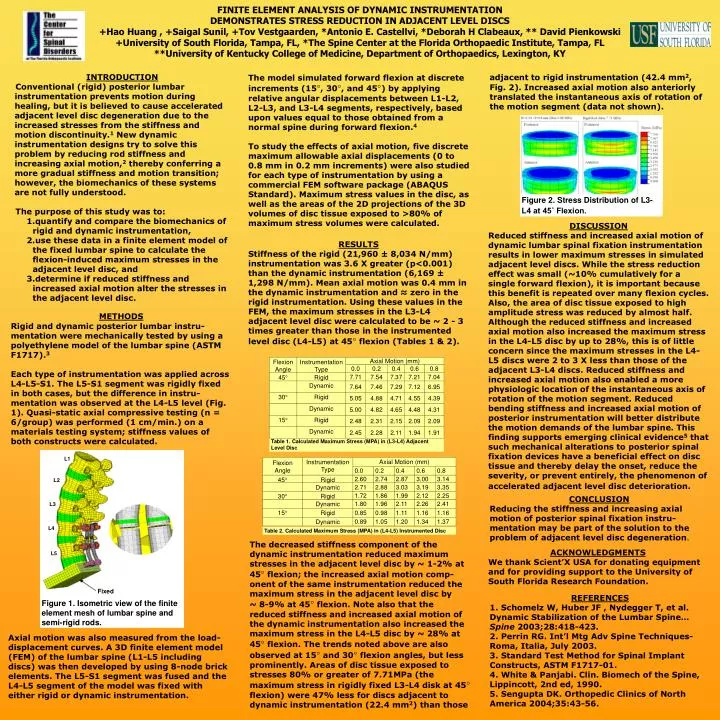
FINITE ELEMENT ANALYSIS OF DYNAMIC INSTRUMENTATIONDEMONSTRATES STRESS REDUCTION IN ADJACENT LEVEL DISCS +Hao Huang , +Saigal Sunil, +Tov Vestgaarden, *Antonio E. Castellvi, *Deborah H Clabeaux, ** David Pienkowski +University of South Florida, Tampa, FL, *The Spine Center at the Florida Orthopaedic Institute, Tampa, FL **University of Kentucky College of Medicine, Department of Orthopaedics, Lexington, KY FlexionAngle Instrumentation Type Axial Motion (mm) 0.0 0.2 0.4 0.6 0.8 45 Rigid 2.60 2.74 2.87 3.00 3.14 Dynamic 2.71 2.88 3.03 3.19 3.35 30 Rigid 1.72 1.86 1.99 2.12 2.25 Dynamic 1.80 1.96 2.11 2.26 2.41 15 Rigid 0.85 0.98 1.11 1.16 1.16 Dynamic 0.89 1.05 1.20 1.34 1.37 Table 2. Calculated Maximum Stress (MPA) in (L4-L5) Instrumented Disc Figure 2. Stress Distribution of L3-L4 at 45˚ Flexion.. L1 L2 L3 Flexion Angle Instrumentation Type Axial Motion (mm) 0.0 0.2 0.4 0.6 0.8 L4 45 Rigid 7.71 7.54 7.37 7.21 7.04 Dynamic 7.64 7.46 7.29 7.12 6.95 Table 1. Calculated Maximum Stress (MPA) in (L3-L4) Adjacent Level Disc L5 30 Rigid 5.05 4.88 4.71 4.55 4.39 Dynamic 5.00 4.82 4.65 4.48 4.31 Fixed 15 Rigid 2.48 2.31 2.15 2.09 2.09 Figure 1. Isometric view of the finite element mesh of lumbar spine and semi-rigid rods. Dynamic 2.45 2.28 2.11 1.94 1.91 adjacent to rigidinstrumentation (42.4 mm2, Fig. 2). Increased axial motion also anteriorly translated the instantaneous axis of rotation of the motion segment (data not shown). • INTRODUCTION • Conventional (rigid) posterior lumbar instrumentation prevents motion during healing, but it is believed to cause accelerated adjacent level disc degeneration due to the increased stresses from the stiffness and motion discontinuity.1 New dynamic instrumentation designs try to solve this problem by reducing rod stiffness and increasing axial motion,2 thereby conferring a more gradual stiffness and motion transition; however, the biomechanics of these systems are not fully understood. • The purpose of this study was to: • quantify and compare the biomechanics of rigid and dynamic instrumentation, • use these data in a finite element model of the fixed lumbar spine to calculate the flexion-induced maximum stresses in the adjacent level disc, and • determine if reduced stiffness and increased axial motion alter the stresses in the adjacent level disc. The model simulated forward flexion at discrete increments (15, 30, and 45) by applying relative angular displacements between L1-L2, L2-L3, and L3-L4 segments, respectively, based upon values equal to those obtained from a normal spine during forward flexion.4 To study the effects of axial motion, five discrete maximum allowable axial displacements (0 to 0.8 mm in 0.2 mm increments) were also studied for each type of instrumentation by using a commercial FEM software package (ABAQUS Standard). Maximum stress values in the disc, as well as the areas of the 2D projections of the 3D volumes of disc tissue exposed to >80% of maximum stress volumes were calculated. DISCUSSION Reduced stiffness and increased axial motion of dynamic lumbar spinal fixation instrumentation results in lower maximum stresses in simulated adjacent level discs. While the stress reduction effect was small (~10% cumulatively for a single forward flexion), it is important because this benefit is repeated over many flexion cycles. Also, the area of disc tissue exposed to high amplitude stress was reduced by almost half. Although the reduced stiffness and increased axial motion also increased the maximum stress in the L4-L5 disc by up to 28%, this is of little concern since the maximum stresses in the L4-L5 discs were 2 to 3 X less than those of the adjacent L3-L4 discs. Reduced stiffness and increased axial motion also enabled a more physiologic location of the instantaneous axis of rotation of the motion segment. Reduced bending stiffness and increased axial motion of posterior instrumentation will better distribute the motion demands of the lumbar spine. This finding supports emerging clinical evidence5 that such mechanical alterations to posterior spinal fixation devices have a beneficial effect on disc tissue and thereby delay the onset, reduce the severity, or prevent entirely, the phenomenon of accelerated adjacent level disc deterioration. RESULTS Stiffness of the rigid (21,960 ± 8,034 N/mm) instrumentation was 3.6 X greater (p<0.001) than the dynamic instrumentation (6,169 ± 1,298 N/mm). Mean axial motion was 0.4 mm in the dynamic instrumentation and ≈ zero in the rigid instrumentation. Using these values in the FEM, the maximum stresses in the L3-L4 adjacent level disc were calculated to be ~ 2 - 3 times greater than those in the instrumented level disc (L4-L5) at 45 flexion (Tables 1 & 2). METHODS Rigid and dynamic posterior lumbar instru- mentation were mechanically tested by using a polyethylene model of the lumbar spine (ASTM F1717).3 Each type of instrumentation was applied across L4-L5-S1. The L5-S1 segment was rigidly fixed in both cases, but the difference in instru- mentation was observed at the L4-L5 level (Fig. 1). Quasi-static axial compressive testing (n = 6/group) was performed (1 cm/min.) on a materials testing system; stiffness values of both constructs were calculated. CONCLUSION Reducing the stiffness and increasing axial motion of posterior spinal fixation instru- mentation may be part of the solution to the problem of adjacent level disc degeneration. The decreased stiffness component of the dynamic instrumentation reduced maximum stresses in the adjacent level disc by ~ 1-2% at 45 flexion; the increased axial motion comp- onent of the same instrumentation reduced the maximum stress in the adjacent level disc by ~ 8-9% at 45 flexion. Note also that the reduced stiffness and increased axial motion of the dynamic instrumentation also increased the maximum stress in the L4-L5 disc by ~ 28% at 45 flexion. The trends noted above are also observed at 15 and 30 flexion angles, but less prominently.Areas of disc tissue exposed to stresses 80% or greater of 7.71MPa (the maximum stress inrigidly fixed L3-L4disk at 45 flexion) were 47% less for discsadjacent to dynamic instrumentation (22.4 mm2) than those ACKNOWLEDGMENTS We thank Scient’X USA for donating equipment and for providing support to the University of South Florida Research Foundation. REFERENCES 1. Schomelz W, Huber JF , Nydegger T, et al. Dynamic Stabilization of the Lumbar Spine… Spine 2003;28:418-423. 2. Perrin RG. Int’l Mtg Adv Spine Techniques- Roma, Italia, July 2003. 3. Standard Test Method for Spinal Implant Constructs, ASTM F1717-01. 4. White & Panjabi. Clin. Biomech of the Spine, Lippincott, 2nd ed, 1990. 5. Sengupta DK. Orthopedic Clinics of North America 2004;35:43-56. Axial motion was also measured from the load-displacement curves. A 3D finite element model (FEM) of the lumbar spine (L1-L5 including discs) was then developed by using 8-node brick elements. The L5-S1 segment was fused and the L4-L5 segment of the model was fixed with either rigid or dynamic instrumentation.