Download
1 / 13
130 likes | 267 Views
Changing household composition. Source: CLG, Homes for the Future (2007). But: Fewer Houses Being Built. A New Urban Hierarchy? From Christaller (1933)…. Type Market area Population Population Radius, km of town of market area M (Marktort) 4.0 1,000 3,500

E N D
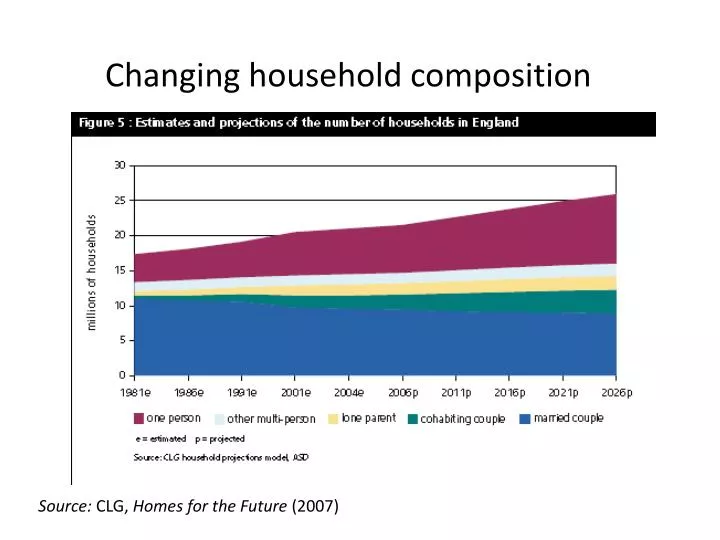
Changing household composition Source: CLG, Homes for the Future (2007)
A New Urban Hierarchy?From Christaller (1933)… Type Market area Population Population Radius, km of town of market area M (Marktort) 4.0 1,000 3,500 A (Amtsort) 6.9 2,000 11,000 K (Kreisstadt) 12.0 4,000 35,000 B (Bezirkstadt) 20.7 10,000 100,000 G (Gaustadt) 36.0 30,000 350,000 P (Provinzstadt) 62.1 100,000 1,000,000 L (Landstadt) 108.0 500,000 3,500,000
…to Taylor (2004): GaWC hierarchy A. ALPHA WORLD CITIES 12: LONDON, Paris, New York, Tokyo 10: Chicago, Frankfurt , Hong Kong, Los Angeles, Milan, Singapore B. BETA WORLD CITIES 9: San Francisco, Sydney, Toronto, Zürich 8: Brussels, Madrid, Mexico City, São Paulo 7: Moscow, Seoul European cities in italics U.K. cities CAPITALISED
The GaWC hierarchy (ctd.) C. GAMMA WORLD CITIES 6: Amsterdam, Boston, Caracas, Dallas, Düsseldorf, Geneva, Houston, Jakarta, Johannesburg, Melbourne, Osaka, Prague, Santiago,Taipei, Washington 5: Bangkok, Beijing, Rome, Stockholm, Warsaw 4: Atlanta, Barcelona, Berlin, Buenos Aires, Budapest, Copenhagen, Hamburg, Istanbul, Kuala Lumpur, Manila, Miami, Minneapolis, Montreal, München, Shanghai
The GaWC hierarchy (ctd.) D. EVIDENCE OF WORLD CITY FORMATION Di Relatively strong evidence 3: Auckland, Dublin, Helsinki, Luxembourg, Lyon, Mumbai, New Delhi, Philadelphia, Rio de Janeiro, Tel Aviv, Wien Dii Some evidence 2: Abu Dhabi, Almaty, Athens, BIRMINGHAM, Bogota, Bratislava, Brisbane, Bucharest, Cairo, Cleveland, Köln, Detroit, Dubai, Ho Chi Minh City, Kiev, Lima, Lisbon, MANCHESTER, Montevideo, Oslo, Rotterdam, Riyadh, Seattle, Stuttgart, Den Haag, Vancouver
Core Cities in the Global Hierarchy:Some Good News from GaWC
Deprivation: Concentrated in London, scattered in South East
Geography of Multiple Deprivation:2004 and 2007 Source: Local Futures, Deprivation Barometer, 2008
Retailing: The March of the Superstores in East Kent Table 10 Location types of superstores in East Kent, 2003 (field work) Type Central Core 5 Core Edge 8 Core Edge/Urban Edge 4 Urban Edge 13 Freestanding 0 Source: Hay 2005