Download
1 / 17
170 likes | 279 Views
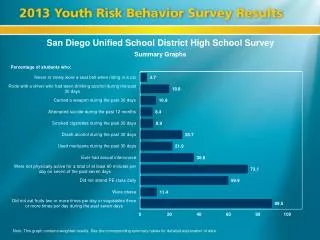
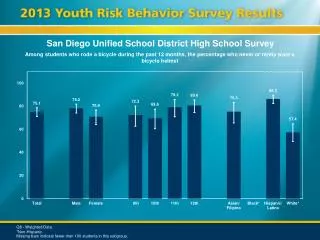
2012 California Standards Tests (CSTs) and California High School Exit Exam (CAHSEE) Grade 10 Census Report Data to inform the evaluation of the district’s LEA Plan. San Diego Unified School District September 11, 2012. Opening Comments.

E N D
2012 California Standards Tests (CSTs) and California High School Exit Exam (CAHSEE) Grade 10 Census ReportData to inform the evaluation of the district’s LEA Plan San Diego Unified School District September 11, 2012
Opening Comments • CST and CAHSEE results inform the evaluation of our LEA Plan • Achievement has increased for seven consecutive years in all 4 CST subjects • District placed 1st on CST ELA among large urban districts; 3rd in mathematics • District placed 1st on CST Science among large urban districts • Achievement gaps for passing the CAHSEE are closing; CST gaps, in most cases, persist
California Standards Tests All Students, Grades 2-11 Combined Percentage of Students At Proficient or Advanced (District-Managed Schools) 27% Improvement
California Standards Tests All Students, Grades 2-11 Combined Percentage of Students At Proficient or Advanced (District-Managed Schools) 53% Improvement
California Standards Tests All Students, Grades 2-11 Combined Percentage of Students At Proficient or Advanced For Selected Racial/Ethnic Groups (District-Managed Schools) +13 points; 37% 2008 - 2012 +8 points; 13% 2008 - 2012 +12 points; 17% 2008 - 2012 +8 points; 13% 2008 - 2012 +16 points; 52% 2008 - 2012
California Standards Tests All Students, Grades 2-11 Combined Percentage of Students At Proficient or Advanced For Selected Racial/Ethnic Groups (District-Managed Schools) +8points; 28% 2008 - 2012 +8 points; 13% 2008 - 2012 +10 points; 17% 2008 - 2012 +7 points; 13% 2008 - 2012 +11 points; 37% 2008 - 2012
California Standards Tests All Students, Grades 2-11 Combined Percentage of Students At Proficient or Advanced English Language Arts — Achievement Gap 36 35 37 40
California Standards Tests All Students, Grades 2-11 Combined Percentage of Students At Proficient or Advanced English Language Arts — Achievement Gap 33 45 34 38
California Standards Tests All Students, Grades 2-11 Combined Percentage of Students At Proficient or Advanced Mathematics — Achievement Gap 31 27 29 27
California Standards Tests All Students, Grades 2-11 Combined Percentage of Students At Proficient or Advanced Mathematics — Achievement Gap 25 18 22 15
California Standards Tests All Students, Grades 2-11 Combined Percentage of Students At Proficient or Advanced English Language Arts Urban District Comparison
California Standards Tests All Students, Grades 2-11 Combined Percentage of Students At Proficient or Advanced Mathematics Urban District Comparison
California Standards Tests All Students, Grades 2-11 Combined Percentage of Students At Proficient or Advanced Science (NCLB) Urban District Comparison
California High School Exit Exam (CAHSEE) Grade 10 Census Percentage of Students Passing
California High School Exit Exam (CAHSEE) Grade 10 Census Percentage of Students Passing Literacy Portion Achievement Gap 19 25 24% reduction in gap 32% reduction in gap
California High School Exit Exam (CAHSEE) Grade 10 Census Percentage of Students Passing Mathematics Portion Achievement Gap 17 29 41% reduction in gap 44% reduction in gap
Closing Comments…Next Steps • Mathematics remains an area in need of extra support • Identify schools with improved scores and determine strategies/practices used at those schools • Identify schools where scores declined or were flat and provide support to implement effective strategies/practices • Perform the above tasks schoolwide and for student groups • Assess available resources to support schools; realign resources, if necessary, to focus on most effective strategies