Download
1 / 79
790 likes | 922 Views
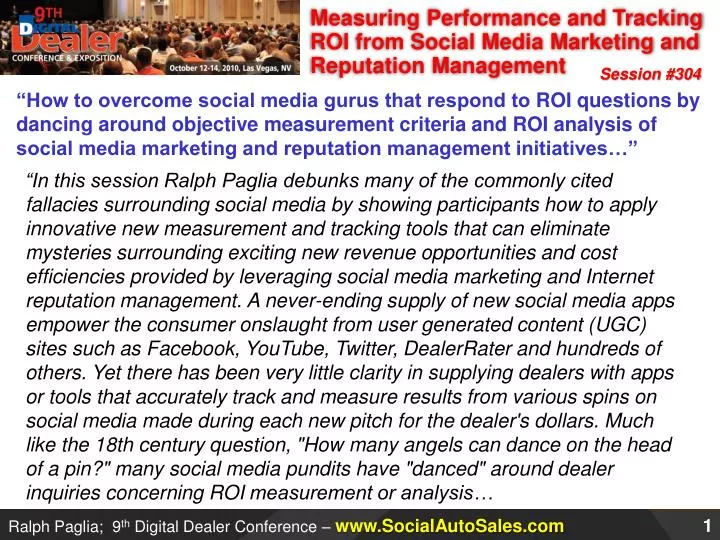
Measuring Performance and Tracking ROI from Social Media Marketing and Reputation Management. Session #304.

E N D
Measuring Performance and Tracking ROI from Social Media Marketing and Reputation Management Session #304 “How to overcome social media gurus that respond to ROI questions by dancing around objective measurement criteria and ROI analysis of social media marketing and reputation management initiatives…” “In this session Ralph Paglia debunks many of the commonly cited fallacies surrounding social media by showing participants how to apply innovative new measurement and tracking tools that can eliminate mysteries surrounding exciting new revenue opportunities and cost efficiencies provided by leveraging social media marketing and Internet reputation management. A never-ending supply of new social media apps empower the consumer onslaught from user generated content (UGC) sites such as Facebook, YouTube, Twitter, DealerRater and hundreds of others. Yet there has been very little clarity in supplying dealers with apps or tools that accurately track and measure results from various spins on social media made during each new pitch for the dealer's dollars. Much like the 18th century question, "How many angels can dance on the head of a pin?" many social media pundits have "danced" around dealer inquiries concerning ROI measurement or analysis…
www.ADPsocial.com Introduction and Background: Ralph Paglia • Director - Digital Marketing • Dealer Services • Currently leading build-out and development of new ADP/ASU Joint Venture at www.SkySongCenter.comin Scottsdale, AZ for new home of expanded ADP/BZ Social Media Reputation Management Team providing“Strategic Implementation” of Fully Managed Solutions for Dealers... • Generated 144,000+ leads in 22 months while working for Courtesy Chevrolet… • Managed Courtesy Chevy Internet Sales team that sold 4,000+ Units in 2006… • Worked w/Ford in 2007-2009 to develop first fully integrated multi-publisher Tier 3 Digital Marketing Consulting and Co-Op supported Advertising program… • Ran 1st retail automotive Behavioral Targeting Digital Advertising program… • Internet Sales & Marketing Consultant to Ford, Mercedes-Benz, GM, Honda, Toyota, Mercedes-Benz, Hyundai and 250+ dealers & groups… • Pioneered development of “Internet Leads” in 1988 using CompuServe ISP access to post new and used vehicle listings on defense contractor BBS’s in San Diego, CA… Cell: 505.301.6369 ralph_paglia@adp.com www.RalphPaglia.com
First things First – What About Return on Investment? ADP has Verified Five Return On Investment (ROI) Areas of Opportunity for Dealers who Implement a Social Media Reputation Management Strategy • “Do not confuse the ability to track and measure results with whether or not it generates a Return On Investment… Your ROI is realized whether or not you have the ability to correctly measure the results!” –- Red McCombs • (FACTOID: McCombs is #1 financially successful car dealer in history)
Return On Investment (ROI): A performance measure used to evaluate the efficiency of an investment or to compare the efficiency of a number of different investments. To calculate ROI, the benefit (return) of an investment is divided by the cost of the investment; the result is expressed as a percentage or a ratio. Keep in mind that the calculation for return on investment and, therefore the definition, can be modified to suit the situation -it all depends on what you include as returns and costs. The definition of the term in the broadest sense just attempts to measure the profitability of an investment and, as such, there is no one “right” calculation. For example, a marketer may compare two different products by dividing the revenue that each product has generated by its respective marketing expenses. A financial analyst, however, may compare the same two products using an entirely different ROI calculation, perhaps by dividing the net income of an investment by the total value of all resources that have been employed to make and sell the product. This flexibility has a downside, as ROI calculations can be easily manipulated to suit the user’s purposes, and the result can be expressed in many different ways. When using this metric, make sure you understand what inputs are being used.
Social Media: Social Media is media designed to be disseminated through social interaction, created using highly accessible and scalable publishing techniques. Social media uses Internet and web-based technologies to transform broadcast media monologues (one to many) into social media dialogues (many to many). It supports the democratization of knowledge and information, transforming people from content consumers into content producers. Andreas Kaplan and Michael Haenlein define social media as “a group of Internet-based applications that build on the ideological and technological foundations of Web 2.0, and that allow the creation and exchange of user-generated content. Businesses also refer to social media as user-generated content (UGC) or consumer-generated media (CGM). Social media utilization is believed to be a driving factor in the idea that the current period in time will be defined as the Attention Age.
Forrester’s ROI methodology Total Economic Impact • Benefits • Quantifiedvalue • Defined metrics Benefits(Impact on business) R I S K Costs(Impact on budget) • Cost • People • Process • Technology Flexibility(Options) • “Options” created • Are there new • opportunities in the future? • Uncertainty • Impact of “assumptions”
Benefits(Impact on business) Examples of Benefits • Cost savings • Reduce call volume • Reduce email volume • Increase BDCproductivity • Increase in FCR • Reduce SEO costs • Profit Improvements • Increase customer lifetime value • Increase Sales Ideation • Increase Lead Conversion Rates Source: May, 2009 “The ROI of Online Customer Communities” Forrester report
There are many benefits of Online Dealer Communities… Source: “The ROI of Online Customer Communities” Forrester
Social Media Results Known = Dealer ROI • Marketing Communications: Create and Publish content that attracts consumers within demographics targeted by social media marketing strategy. Use Social Apps to engage/interact/convert. • Reputation Management: • Monitor social web for content posted containing dealership brand. • 911 Fast Response Strategy and Process for negative content posted. Notify dealer POC’s of what was posted, when and by who. Send POC copy, including response published and actions/due dates required • “Social Rewards” strategy for positive posts, comments and mentions • Promptly create and post appropriate responses to all dealership mentions so people see your store cares, pays attention, responds, appreciates compliments and resolves customer concern issues • Traffic Generation: Use anchor text and linked content to drive targeted traffic from social media sites into dealer’s social assets and websites, incoming phone calls to social media assigned numbers, use stories to drive showroom traffic • Improve SEO Strategy: Quickly increase the dealership SEO “footprint” with multiple SERP listings from dealer’s Social Media accounts and profile subdomains. Back links from hundreds of Social Media sites to dealer’s eCommerce sites boost authority and rank with search engines.
Social Media Marketing Objectives Create and Publish high quality content that attracts and engages people in demographic categories your overall dealership marketing programs seek and target Monitor what people are saying about your dealership and report to key dealership stakeholders on what is posted, when, where and by who Promptly create and post appropriate responses to all dealership mentions so people see your store cares, pays attention, responds, appreciates compliments and resolves customer concern issues Drive high quality traffic from social media to targeted destinations defined by dealership’s marketing strategy Improve SEO “footprint” by creating multiple SERP listings for dealership Social Media accounts
History and Correlation Good ROI analysis almost always requires accurate historical information (which few dealers have). Capturing and analyzing historical data requires time and discipline. It’s easy to cast aside analytical tasks when everyone is focused on generating profit. However, you can’t forecast the future without understanding the past. Historical datasets a baseline for measuring the “Delta”.That change can then be measured and compared to actions that may have caused it. If you can correlate action to impact, then you can calculate ROI.
Automotive Avenues Internet Sales LeadsBefore Investing in Social Media Marketing 2,383 Leads Submitted Annually (Above the National Average for metro car dealers of 968)
Automotive Avenues Internet Sales Leads AfterInvesting in Social Media Marketing 6,340 Leads Submitted Annually 166% IncreaseDuring Worst Economic Climate in 30 Years!
History and Correlation In the following example, lead activity appears to correlate positively with traffic to all the dealer’s blogs. The positive correlation is indicated by the change from baseline, which appears to correspond with the upward movement in blog traffic. Even then, a definitive correlation can’t be established until other factors are eliminated from consideration, such as a promotion or a new advertising campaign. Identifying correlations can be a time-consuming process, requiring new variables to be introduced independently of each other so that change can be isolated. However, you don’t necessarily have to test only one variable at a time. With split testing, you can try two different experiments, each targeting a different segment of your customer base.
Does Blog Traffic Lead to Increased Volume of Internet Sales Leads? Sales Leads Blog Visitors
Metrics Web analytics today deliver unprecedented insight about online interactions. The basic features of the free Google Analytics service match the capabilities of products that cost thousands of dollars just a few years ago. Premium services like Webtrendsbuild in sophisticated behavioral and sentiment analysis and can track offsite activity such as a prospect’s comments on Twitter or use of a mobile application. They can even trigger customized e-mails or tweets when a person’s behavior matches certain predefined patterns. With all this rich data now available, it’s remarkable how many marketers still use the basic metrics of traffic and unique visitors to measure success. We’re not big fans of these measurements; it’s easy to generate spikes of valueless traffic by posting celebrity photos or top-10 lists, for example. In Chapter XX, we listed some common metrics you can use and how they relate to different business goals. We think richer measures such as referring keywords, top content, bounce rate, average time spent on site, pages-per-visit and content analysis yield more actionable insight that will only get better.
Metrics The best way to select relevant metrics is to work backwards. Start with sales trends, match them to Web activity and look for the metrics that correlate most closely. Those are the metrics that are most meaningful to you. For example, if an increase in session time spent on site appears to correlate with registrations for a webcast, then that indicates that webcasts resonate with the audience. You also shouldn’t confine metrics to those which can be measured online. One of the most popular indications of customer satisfaction is the Net Promoter Score (NPS), introduced in 2003 by Fred Reichheld of Bain & Co. Obtaining an NPS requires asking customers a single question on a 0-to-10 rating scale: “How likely is it that you would recommend our company to a friend or colleague?” This simple tactic has been adopted by big B2B companies like General Electric and American Express as a key performance indicator. You can also choose to monitor classic metrics that have nothing to do with the Internet. These include press mentions, speaking invitations and performance on customer satisfaction surveys. Metrics also vary by objective. For example, the success of a blog set up to generate leads may be measured by inquiries, time spent on site and to repeat visitors, while one targeted at search optimization may be evaluated based on keyword rankings and inbound links. For ROI purposes, though, the choice of metrics is less important than your ability to correlate behavior to results. In other words, if certain page views are more valuable than others, then an increase in traffic and session time could be a good starting metric for evaluating ROI. Just be aware that they are imperfect indicators of visitor engagement.
Metrics One thing you absolutely need to know, however, is how people reach your site. Unique URLs are a way to measure that. We’re astonished at how many e-mails we still get from brand-name companies that don’t make use of this simple tactic, which enables a marketer to specify a web address that is unique to the e-mail, tweet, wall post or any other message. Unique URLs use a simple server redirect function to identify the source of an incoming click. They look like this: http://mycompany.23.com/public/?q=ulink&fn=Link&ssid=5155. Everything after the word “public/” is a unique code that tells where the visitor came from. Unique URLs enable your analytics software to track inbound traffic from each source separately so you can determine the ROI of each channel. Without unique URLs, visits are simply classified as “direct traffic,” meaning that the source could be a forwarded e-mail, bookmark or an address typed into the browser. A simple example of how you might use this information is to measure traffic to a landing page and analyze the number of visitors who fill out a registration form according to the referring source. This would show you, for example, that registration rates are twice as high from a newsletter as from a tweet. The value of those registrants divided by the cost of the newsletter is an ROI metric. Unique URLs are also valuable to split testing; you can try out two different invitation messages in the same email and use a different URL for each to measure response to each message.
Metrics PUTTING IT ALL TOGETHER Let’s apply all the factors we’ve described above to two B2B social marketing scenarios. First, we’ll compare the ROI of webcasts to white papers. Start with historical data. What is the conversion rate of webcast viewers versus people who download a white paper? What is the lifetime value of an average customer? Compare the outputs and divide by costs to assess ROI: Let’s assume the following: • · The average lifetime value of a customer is $50,000 at a 10% profit margin. • Average cost of delivering webcast to 100 registered viewers = $3,000 • Viewers convert at a 2% rate • Average cost of delivering white paper to 500 registrants is $10,000 • Registrants convert at a 1% rate. Our ROI analysis looks like this:
Lead Generation Let’s look at one more example in which we use a blog for lead generation. We know that performance will be slow during the first few quarters until search engine traffic kicks in. Based upon the experience of others, we believe that lead growth will improve steadily as traffic builds. We expect to be at 50 leads per month by the end of the first year and 160 per month by the end of the second. Our historical data tells us that a lead is worth $100. We further estimate our editorial costs at $2,000 per quarter during the first year, doubling to $4,000 during the second. Here’s our analysis of quarterly and cumulative ROI.
Measuring Intangibles The trickiest aspect of ROI analysis is accounting for intangibles. These include factors like customer satisfaction, customer loyalty, brand reputation and market influence. Many social marketing projects are justified for these reasons but the outputs are never measured, either because it’s not worth the effort or because the measurements aren’t in place. In fact, all of these outputs can be measured and have been for years using some of the following tests:
Valuing Twitter Followers When marketers get up on stage to describe their social marketing successes these days, they invariably refer to follower and fan totals. On Twitter, follower counts have become a sort of merit badge, despite the fact that anyone can quickly run up that number by simply auto-following everyone who follows them. There are even paid services that inflate follower totals. What is the true value of a Twitter follower? There is no industry standard to calculate that number, but if you have the right metrics in place, you can do that for your own organization. Here’s how: Look at the total number of clicks to your site from Twitter in any given month and divide that by the number of tweets you posted. This gives you the average visits per tweet. Once you have this number in hand, you can look at the behavior of visitors who arrive from Twitter and compare it to those who find you from other sources. Look at page views per visit, time spent on site and visitor paths to identify what percentage of Twitter visitors become leads or customers. Using your standard qualifying metrics, you should be able to determine the average value of a Twitter visitor. For example, if 1,000 visitors arrived from Twitter in a given month as a result of 20 tweets, that yields an average of 50 visits per tweet. If you know that 5% of Twitter visitors register for a download or newsletter, and that the value of an average registrant is $50, then you can calculate that Twitter delivers $2,500 in business value, or an average of $125/tweet. If you have 5,000 followers, then you can also calculate that an average follower is worth 2.5 cents. This formula is overly simplistic, of course. Not all Twitter followers are created equal. If you want to dive deeper into the mechanics of influence, services likeTweetReach.com and Twinfluence.com can calculate the total reach of your followers or tweets according to so-called “second-order followers,” or those who follow the people who follow you. These metrics can also be used to estimate the value of retweets by certain popular members. This same approach may also be applied to finding the value of Facebook fans, LinkedIn connections, SlideShare followers and the like.
When it comes to measuring and tracking online and trying to determine what your return on investment is with social media, you first need to ask yourself why you want to participate in social media in the first place. If the answer is to build your brand and develop a loyal following, then you are in it for the right reasons. Currency in social media is found in both relationships and content.
Still, you can't improve what you don't measure. So if your goal is to measure traffic, sales, or SEO ranking, here are some free tools that can help: Google Analytics and Feedburner.com are essential, free tools to help analyze your company's website or blog traffic, subscriber count, and keyword optimization, as well as additional trends. Gr.aiderss.com allows you to enter a feed URL and returns statistics about its posts. The most popular statistic is based on how many times they are shared on a variety of social networking sites. GetClicky.com shows you every action a visitor makes and offers a dedicated iPhone version. Socialmeter.com checks your website's social popularity. Statsaholic.com compares rankings and other information on up to three websites at a time.
Webslug.info compares your site's performance to any other site. Xinureturns.com is great for adding a URL and for receiving a load of useful statistics ranging from search engine optimization (SEO) to social bookmarking and more. Sometrics.com is an analytics site that measures your social advertising efforts. Pagealizer.com is a web analytics that actually suggest changes and optimizations for your pages. StatsAdvisor.com is another great web analytics that helps you track both online and offline advertising efforts.
a balanced social media marketing scorecard will consider and monitor effects across four perspectives that balance the short- and long-term implications while looking at direct and indirect financial implications. These four are: • Financial metrics • Digital metrics • Brand Metrics • Risk Management
First of all, ROI is a business metric, not a media metric. Stop calling measuring social media marketing success a calculation of “ROI.” It’s not if you’re measuring all of what social media can do. • There’s also a lot of what social media marketing does that isn’t covered in their reporting mechanism. My own presentation from the Social Media Success Summit this year outlined five areas of benefit for a company’s social media marketing efforts and details how to measure them. They are: • Branding and Awareness • Building Community • Customer Service • Research and Development • Direct Sales
How Do You Calculate the ROI of a Blog? • Domain name/hosting = $20 - $30 per month • Software = Using WordPress or similar – free ($150 for set up) • Monthly blogging service = DIY or pay $500 - $5,000 / month You could hire a designer to put together a sleek design for you and pay anywhere from $500 to several thousand dollars. You may get what you pay for, but… There is also a time commitment. How much is your time worth? OK, so what are the benefit? They are legion: • Increased Search Engine Presence • Customer Feedback • Link Ppopularity and PageRank • Targeted traffic to your website • Increased sales volume
Birth of a Social Community ADP builds AnciraCommunity.com integrated w//Facebook, Twitter, Flickr, etc. Ancira personnel & suppliers set-up profiles - Get engaged – Create Content Social Media Case Study: Ancira Auto Group Registration / Publication Site Registered in 120 Social Venues Web based console manages all accounts Will you be my Facebook friend? Subscribe to our YouTube channel Follow Us on Twitter User Content Fun Stuff ForCustomers Road tests, reviews & how to’s “Canine Romance Blooms…” Syndicated Content Interviews with Civic leaders Relevant Info From Other Sources Dealer Information Ancira Crafts Their Message Employees engage discussions Local Interest Highlight AnciraCivic Leadership Become local social media leader 3 4 5 6 1 2
Case Study: Ancira Auto Group – San AntonioSocial Media Reputation Management Results Positive customer feedback “Heaters Become Raving Fans” “I am absolutely blown away that you not only responded… but that you use social media” “I will be happy to explain to everyone the fantastic service I received…” SERP Returns10 pages of AnciraSocial Media content Branded Search ancira dodge san antonio ancira auto group ancirachevrolet ancirakia san antonio Search Engine Results (SERP) Consumer Response to Social Media Advertising
11,159 People Visited AnciraCommunity.com • 18,374 Visits • 11,159 Absolute Unique Visitors • 90,715 Pageviews • 4.94 Average Pageviews • 00:04:32 Time on Site • 48.12% Bounce Rate • 60.36% New Visits
What is the Display Advertising Media Equivalent Value of AnciraCommunity.com Impressions? • 18,374 Visits • 11,159 Absolute Unique Visitors • 90,715 Pageviews • The aggregate average Cost Per Thousand Impressions (CPM) for “Automotive Intender” websites geotargeted within the San Antonio market area is $7.57 CPM… • 90,715 Pageviews = 907.15 CPM Units • 907.15 x $7.57 = $6,867.13
What is the Google Adwords Pay Per Click (PPC) Search Advertising Media Equivalent Value? • 18,374 Visits • 11,159 Absolute Unique Visitors • 90,715 Pageviews • The aggregate average Cost Per Click (CPC) for Google Adwords campaigns for automotive relevant keywords geotargeted within San Antonio Metro is $2.64 CPC… • 18,374 Community Visits = 18,374 Click Throughs • 18,374 Clicks x $2.64 CPC = $48,507.36
What is the comparable Cost Per Unique Visitor Equivalent Value? • 18,374 Visits • 11,159 Absolute Unique Visitors • 90,715 Pageviews • The aggregate average Cost Per Unique Visitor (CPUV) for all other Ancira Auto Group online campaigns focused on driving traffic to Ancira Web Sites $2.12 CPUV… • 11,159 Unique Visitors • X $2.12 CPUV • ------------------------------------ • $23,657.08
What is the Social Media Aggregate Equivalent Media Value Average for AnciraCommunity.com within the time period measured? • $6,867.13 CPM • $48,507.36 PPC • $23,657.08 CPUV • ------------------------ • (79,031.57 / 3) = $26,343.85
Automotive Avenues Community Google Analytics (3 weeks of Facebook Advertising Campaign)
(3 weeks of Facebook Advertising Campaign) ROI Lesson Learned: Facebook Advertising works best when used to drive traffic to, and promote Facebook Dealer Pages, Groups and Special Offers hosted within Facebook.com