Download
1 / 6
60 likes | 153 Views
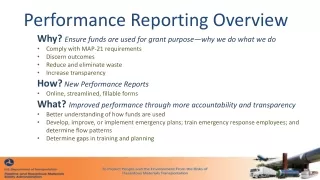
Performance Report Overview . New Jersey Department of Education. Purpose. Enable stakeholders to engage in local goal setting, improvement planning, and performance management. Focus attention on data metrics that research has shown to be indicative of college and career readiness.

E N D
Performance Report Overview New Jersey Department of Education
Purpose • Enable stakeholders to engage in local goal setting, improvement planning, and performance management. • Focus attention on data metrics that research has shown to be indicative of college and career readiness. • Enable benchmarking of multiple metrics against an appropriate set of comparison schools. New Jersey Department of Education
Similarities to Report Card Many of the same data tables as in the past: • Statewide assessment data in grades and subgroups • Enrollment data – student demographics and language diversity • Percentage of students taking the SAT and outcomes • Enrollment in AP classes • School characteristics, such as length of school day • NAEP outcomes • Graduation and dropout by subgroups • Graduation by pathways New Jersey Department of Education
Also included… • Progress targets – ESEA Waiver • Graduation rate – 4 and 5-year cohort • Measurement of student growth • Percent of students scoring at College Readiness level on SAT, i.e., 1550 and above • Percent of ‘unique’ participation in AP courses in English, math, social studies, and science and scores 3 or better • Percent of middle school students taking Algebra I and earning a C or better • Percent chronically absent • Percent of students enrolled in post-secondary New Jersey Department of Education
Peer Comparisons • Each school has a group of peer schools • Determined by using school configuration and student-level demographic and program data, such as free/reduced lunch participation, LEP, and special education. • Each performance report will list a school’s peer schools. New Jersey Department of Education
Questions? New Jersey Department of Education Thank You!