Download
1 / 11
110 likes | 208 Views
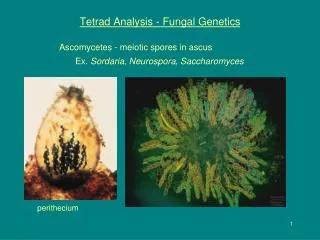
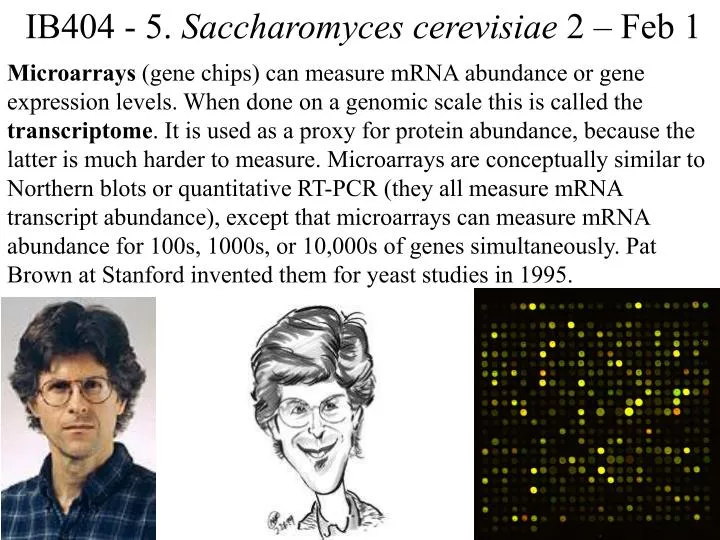
IB404 - 5. Saccharomyces cerevisiae 2 – Feb 1.

E N D
IB404 - 5. Saccharomycescerevisiae 2 – Feb 1 Microarrays (gene chips) can measure mRNA abundance or gene expression levels. When done on a genomic scale this is called the transcriptome. It is used as a proxy for protein abundance, because the latter is much harder to measure. Microarrays are conceptually similar to Northern blots or quantitative RT-PCR (they all measure mRNA transcript abundance), except that microarrays can measure mRNA abundance for 100s, 1000s, or 10,000s of genes simultaneously. Pat Brown at Stanford invented them for yeast studies in 1995.
Fabrication: Originally, and most simply, microarrays are made as spots of particular DNA samples on glass slides. These spots can be really tiny, e.g. 100 microns across and 200 microns apart, so that under a 22X40mm glass coverslip one can place 30,000 spots. The DNA for each spot was generated using PCR so you have a lot of it to make many slides. The template might be the inserts of cDNA clones from an EST project, or one might design primers to amplify ~500bp regions of identified genes from a genome project (amplicons). Alternatively one can design 70mer oligonucleotides to each gene or even each exon of each gene annotated in a genome. The spotting is done with a robot (picture). The glass is treated with a positively charged chemical to which the DNA is attracted, and then covalently linked at high temperature or UV cross-linked.
Hybridization: Each microarray can be used to measure relativegeneexpression between two samples. mRNA is extracted from two samples and then labeled with two different fluorescent dyes. In the simplest method, the mRNA is reverse transcribed with a fluorescently-labeled nucleotide incorporated into the resultant cDNA (Cy3-dCTP “green dye” or Cy5-dCTP “red dye”). The two labeled cDNA samples are mixed and hybridized to the microarray (under a cover slip) overnight. Slides are then washed and “scanned” (the fluors are excited by UV laser and imaged by CCD microscope) to produce a digital image of microarray spots. The relative amount of “red-” and “green-” labeled cDNA that is stuck to each microarray spot (i.e., each gene) is an indication of relative amount of mRNA for that gene from the two tested samples. Yellow indicates equal mRNA level in both samples. Black indicates too low expression. reverse transcription hybridization
Affymetrix in California invented an alternative approach combining photolithography and combinatorial chemistry. Thus in each step all those spots requiring a particular base, say T, are de-protected and a blocked T is added, then the next nucleotide, etc, building up to having 25mers at each spot. They can manufacture unlimited numbers of spots. This and similar approaches are the kind of technology that allows for genome-wide tiling arrays with millions of spots, which allows one to examine the details of transcription of a genome in an unbiased fashion. These kinds of microarrays are hybridized in a different way, involving a single sample at a time, with the comparisons being made to various internal standards, hence allowing absolute, rather than relative, levels of transcription to be determined.
Transcriptome using microarrays The California gang of microarray gurus and yeast experts used this technology to study meiosis and sporulation in yeast - 150 genes known. Patrick Brown Stanford David Botstein Stanford/Princeton Ira Herskowitz UCSF
They identified a total of about 500 genes up-regulated and another 600 down-regulated during sporulation, so +20% of genes change. They were able to split the process into 7 categories by clustering. They identified new regulators of the process, and promoter motifs. Countless other comparative experiments have been done using arrays.
Mass spectrometry 1. Input is any “pure” sample. 2. Ionize it first, usually positive. 3. Separate the ions. 4. Detect the ions. 5. Produce spectrum of relative amount of each ion against its mass/charge ratio in Dalton/Z. 6. Dalton is mass of atom of C. 7. Z is charge of electron. 8. Simple example here is for acetone, CH3COCH3. 9. For proteins need to break into peptides first, then compare with predicted sizes from genome.
Proteomics by MS 1. Use 725 proteins tagged with an epitope as bait - 10% of proteome, primarily kinases, phosphatases, and DNA repair pathway. 2. Immunoprecipitate complexes of each. 3. Separate proteins in each on PAGE. 4. Cut bands and run MS on each. 5. Total of 16,000 bands/1m MS spectra. 6. 35,000 protein identifications. 7. 8,000 possible interactions, filtered to about 3000 “real”. 8. These involve 1500 proteins or 25%. 9. Identify a complex of DNA damage repair proteins centered around a protein kinase, Dun1.
Poly-A tail complex 1. Fig A. shows PAGE gels of immunoprecipitates with tagged proteins, one at a time. Identities of the various proteins shown on right. 2. Schematic of the complex, showing the new players in blue. 3. This is just one example of the many large multi-protein complexes that do all the major processes in cells, e.g. transcription, splicing, translation, export, etc.
Tagging of proteins with GFP allows visualization of locations of each protein - roughly 4000 could be seen. Most proteins localize to the cytoplasm or nucleus, but large numbers go to the mitochondrion, various membranes, and smaller compartments (below).
Numbers of each protein can be measured - ranging from 50-1 million. Method is far more sensitive that others, can even measure transcription factors. 100-10,000 protein molecules per mRNA molecule!